Download
1 / 22
220 likes | 238 Vues
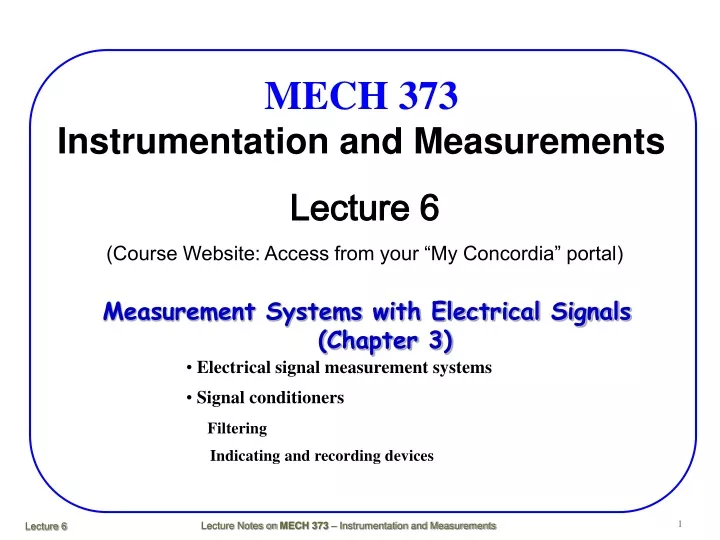
MECH 373 Instrumentation and Measurements. Lecture 6 (Course Website: Access from your “My Concordia” portal). Measurement Systems with Electrical Signals (Chapter 3). • Electrical signal measurement systems • Signal conditioners Filtering Indicating and recording devices.

E N D
MECH 373Instrumentation and Measurements Lecture 6 (Course Website: Access from your “My Concordia” portal) Measurement Systems with Electrical Signals (Chapter 3) • Electrical signal measurement systems • Signal conditioners Filtering Indicating and recording devices
Filter input output Outlines of Filter Design Filtering: Certain desirable features are retained Other undesirable features are suppressed
Signal Filter Analog Filter Digital Filter Element Type Frequency Band Passive Active Low-Pass Band-Pass All-Pass High-Pass Band-Reject Classification of Filters
Classification of Filters Butterworth filters have the characteristic that they are maximally flat in the passband. This means that the gain is essentially constant in the passband. For lowpass Butterworth filters with unity dc gain, the gain as a function of frequency f and order n is given by where n is the order of the filter. For a first-order filter (n=1) this means that each time the frequency doubles, the gain will be reduced by a factor of 2. http://en.wikipedia.org/wiki/Butterworth_filter
Low-Pass Butterworth filter • Maximally flat in pass-band with constant gain • Gain = G = 1/√((1+f/fc)^2n). • n = order, fc = corner frequency. • f/fc >> 1.0; G = (fc/f)^n. • n = 1, double the frequency = half the gain, 2f = 0.5G – 6dB per octave. • e.g. n = 1, fc =1500Hz, • f1 = 15,000Hz – G1 = -20dB; • f2 = 30,000Hz, - G2 = -26dB. • Roll-off in stop-band – 6n dB per octave, e.g., n=8, 48db per octave. 8
Classification of Filters Chebyshev filters have a much crisper change in slope but at the price of ripple in the passband gain, as shown in Figure 3.18. Chebyshev filters with no passband ripple have the same frequency response as the Butterworth filters. High-order Chebyshev filters are more satisfactory than Butterworth designs for notch filters. http://en.wikipedia.org/wiki/Chebyshev_filter
Classification of Filters Elliptic filters have a very crisp transition between the passband and the stopband but allow ripples in the stopband as well as the passband. http://en.wikipedia.org/wiki/Elliptic_filter
Classification of Filters As with amplifiers, filters alter the phase of components of the signal as a function of frequency. For example, the phase-angle shift for an eighth-order Butterworth filter is 360° at the cutoff frequency. For higher-order filters, this phase response can introduce serious phase distortion. Bessel filters are often used because they have a more nearly linear variation of phase angle with frequency in the passband than that of higher-order filters of other classes. http://en.wikipedia.org/wiki/Bessel_filter
Example – Butterworth low pass filter Transducer signal – Amplitude =+/-10v, Frequency up to 20Hz. Superimposed on this signal – 60Hz noise with an amplitude of 0.2v – need to attenuate this noise signal to less than 5% of its value. Corner frequency fc = 30Hz. Calculate order of filter: G = Vo/Vi = 0.05 = 1/sqrt(1+(f/fc)^2n). f = 60Hz, fc = 30Hz. n = 4.32 say 5. 14
Signal-To-Noise Ratio (S/N) Terminology in Filter Design • Noise ref: 1e-12w, conversation = 20e-6w – 73dB, Chipping hammer = 1w – 120dB. • Bandwidth the range of frequencies of |G(jw)|>0.707 • Cutoff Frequency the end of pass-band frequency • Break-point of a filter the point with a gain of -3dB
R C Vout Vin RL Vout Vin w wp ws Passive Low-Pass Filter • The pass-band is from 0 to some frequency wp. • Its stop-band extends from some frequency ws, to infinity. • In practical circuit design, engineers often choose amplitude gain of 0.95 for passive RC filters:
C Vout R Vin Vout Vin w ws wp Passive High-Pass Filter • Its stop-band is from 0 to some frequency ws • The pass-band is from some frequency wp to infinity. • In practical circuit design, engineers choose amplitude gain of 0.95 for passive CR filters:
Indicating and Recording Devices Digital Voltmeters and Multimeters Figure 3.26 shows a typical hand-held digital multimeter (DMM) An important component of a digital voltmeter is an analog-to-digital (A/D) converter, which converts the input analog voltage signal to a digital code that can be used to operate the display. Digital multimeters can be used to display other types of input signals, such as current or resistance or frequency.
Indicating and Recording Devices Oscilloscopes If the output of a sensor is varying rapidly, a digital voltmeter is not a suitable indicating device and an oscilloscope (scope) is more appropriate. In this device, shown in Figure 3.27, the voltage output of the signal conditioner is used to deflect the electron beam in a cathode ray tube (CRT).
Oscilloscopes The CRT consists of a heated cathode that generates free electrons, an anode used to accelerate an electron beam, two sets of deflection plates, and a front face (screen) that is coated with phosphor When voltages of suitable amplitude are applied to the deflection plates, the electron beam will be deflected and cause the phosphors to glow at a particular position on the screen. The deflection plate voltage is proportional to the input voltage, and so the visible deflection is proportional to the input voltage. A block diagram of the basic circuit elements used to control the CRT is shown in Figure 3.29.
Indicating and Recording Devices Strip-Chart Recorders
Data Acquisition Systems A measurement system could consist of a single sensor, appropriate signal conditioning, and an indicating device such as a digital voltmeter. Then a data acquisition system can be used for accepting the outputs from several sensors and record them. Each of the inputs to the acquisition system is called a channel.