Download
1 / 39
390 likes | 487 Vues
June 2010. CSA 2010 Dealing with Deficiencies. Mark Langer, New York Rich Bleser, Milwaukee Joseph Darby, Portland Doug Dickinson, Green Bay. Agenda. Recent changes Time line Data Review Process How BASIC scores are determined Strategies to improve BASIC scores.

E N D
June 2010 CSA 2010Dealing with Deficiencies Mark Langer, New York Rich Bleser, Milwaukee Joseph Darby, Portland Doug Dickinson, Green Bay
Agenda • Recent changes • Time line • Data Review Process • How BASIC scores are determined • Strategies to improve BASIC scores
Timeline of Implementation April 12 – November 30, 2010 – Motor carriers can preview their own data by seeing their roadside inspections/violations and crash events organized by Behavior Analysis and Safety Improvement Category (BASIC).
Timeline of Implementation June – The Operational Model (Op-Model) Test will end. July – The four “50/50” Op-Model Test states, Colorado, Georgia, Missouri and New Jersey, will join the five 100% Op-Model Test states in implementing the program. August – Motor carriers will be able to see an assessment of their violations based on the new Carrier Safety Measurement System (CSMS) which will replace SafeStat later in 2010. Fall 2010 SafeStat will be replaced by the CSMS. CSMS will be available to the public, including shippers and insurance companies. FMCSA/States will prioritize enforcement using the CSMS. FMCSA will begin to issue Warning Letters to carriers with deficient BASICs. Roadside inspectors will use the CSMS results to identify carriers for inspection. Winter 2010 - Safety Fitness Determination Notice of Proposed Rulemaking (NPRM) is scheduled to be released. 2011 – Enforcement staff will be trained, and new interventions will be implemented State-by-State
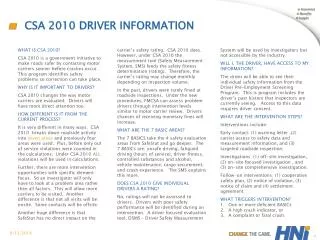
What is the CSA 2010 Data Review? Website that organizes existing carrier safety performance by CSA 2010’s BASICs Inspection data (24 months) Crash data (24 months) Provides information and best practices for improving carrier safety Allows carriers to identify trends in safety performance in order to begin addressing problems today
Why Provide a Data Review? Incremental step toward SMS implementation Understanding the 7 BASICs and violations tied to each Proactively engages industry to improve safety and prepare for CSA 2010 Carriers are given an opportunity to review and update data dataqs.fmcsa.dot.gov/login.asp MCS-150 updates Advance notice prior to rollout
Data Review Access Details Carrier can only access their own results Access requires carrier PIN https://li-public.fmcsa.dot.gov/LIVIEW/pkg_registration.prc_option_decision CSA 2010 Test Carriers will continue to have access to CSI as well as the Data Review Public will not have access to Data Review FMCSA and State Partners have access to every carrier’s data review
Login Page for Motor Carriers through the FMCSA (Compass) Portal
Data Review –Violation Drill Down Violations found in the BASIC and their counts Detailed Inspection Reports related to the BASIC
Data Review –Violation Drill Down Link to DataQs to request a data review Access CSA 2010 information to prepare for implementation Link to Information Center with tips and FAQs
Frequently Asked Questions Question: What does the data displayed in the Data Review mean and what should I do with it? Response: The Data Review is designed to allow you to review: Inspections, violations and crash data that will be used to assess your performance in SMS. These are activities currently linked to your DOT#. Data for accuracy. Behaviors demonstrated by your drivers through violations that may require attention (i.e. sort your various BASIC data by driver name to review performance by those operating for you.)
How Calculated • How long ago it occurred • Severity of inspection or crash • Normalize the data by inspections or power units • Place into Peer Group • Ranked in each peer group as percentiles • Intervention Threshold
Time Weight • Violation in last 6 months = multiplier of 3 • Violation date 6 to 12 months ago = multiplier of 2 • Violation date 12 to 24 months ago = multiplier of 1 • Over 24 months = no impact on carrier
Severity Weight • Level of crash risk from violation • Rated 1 to 10 (lowest to highest risk) • OOS weight of 2 added to each out of service item • Capped at 30 for a single inspection • Crash Indicator • Tow only Weight of 1 • Injury – Fatality Weight of 2 • Hazardous Materials release additional 1 point
Summary of Strategies • Decrease the negative events • Decrease the numerator • Increase the number used to normalize the data • Increase the denominator • Change intervention Level • Update MC150 if no longer moving people or hazardous materials
Calculations – Power Unit Based • Unsafe Driving • Controlled Substances / Alcohol • Crash Indicator (Will be miles & power units) >>> More inspections will not reduce the score
Calculations – Inspections Based • Fatigued Driving • Driver Fitness • Maintenance • Cargo- Related (size, weight, load securement, hazardous materials) >>> More CLEAN inspections WILL reduce the score
Decrease the negative events Focus on who is driving the numbers • 6-8 % of the drivers are causing 80% of the violation points • Measure results • Accountability & Clear expectations
Internal ControlsUnsafe Driving – Addressing speeding • Are you taking this seriously? • Do I have a speed policy? • Do I have my vehicles properly set for top speed? • Do I have a speed alert on my GPS? • Do I regularly conduct a download from my ECM for high speeds? • Do I manage my mechanics so no one cheats the speed? • Do I take motorists reports seriously? • How do I check my drivers logs for over speed? Do I have a policy for HOS speed? Does it have teeth? Do we enforce it? Do we discharge for it? • Are drivers held accountable for warning tickets? • Do I conduct covert and overt surveillance?
Fatigued Driving • Manage hours of service • Dispatchers held accountable • Log falsification checks • Move to electronic logs
Driver Fitness • Manage expiration process • Medical qualification • CDL • Endorsement • MVR checks • Disqualified drivers • Semi-annual MVR check process • Violation alerts
Maintenance / Cargo • Identify components failing • Operations education • Business as usual no longer acceptable • Mechanic education • Driver education • Manager / Mechanic man safety lanes • Review load securement process • Review maintenance inspection program • DVIR • PM process
Decrease the negative eventsMaintenance & Cargo • Time Weighted Applicable Violations • Review Data and determine most impactful • Type of defect • Defects by facilities • Equipment type 3 of top 4 light related
Crash Indicator • Management controls – Safety culture • Defensive driving program • Driver education and preparation • Technology • Hard braking • Roll stability • Other emerging technology • Actions following near misses • Motorist complaints • Driver monitoring programs • Driver recertification (post loss or annual process)
Will Help Fatigued Driving Driver Fitness Maintenance Cargo- Related Can Only Hurt Unsafe Driving Controlled Substances / Alcohol Crash Indicator Increase the DenominatorGetting more inspections >>> Understand where clean inspections come from and work to increase the inspection there
Summary • Monitor data and take actions • Access FMCSA Portal • DataQ to remove incorrect data • Analyze and trend • Understand and address primary causes of negative events • Unsafe drivers • Ineffective mechanics / vendors • Systemic changes to management controls • Educate – Educate – Educate • Defensive driving • Impact of CSA on operations
FMCSA will stay on schedule “For two months, carriers have been able to view their data. . . . I can’t say it often enough, if carriers aren’t looking at their data, shame on them,” she said. “By the end of August, they’ll see the rating system, the measurement system and, by the end of the year, the public — that’s the insurance industry, that’s the shipping industry, and everybody else will have access to all that data as well.” Then, Ferro said, during 2011, “you’ll start to see the phased rollout of the actual intervention processes, state-by-state and carrier-by-carrier.” -FMCSA Administrator Anne Ferro quoted in June 21, 2010 issue of Transport Topics
Questions / Discussion For more information contact • Joe Darby joseph.darby@marsh.com • Doug Dickinson doug.dickinson@marsh.com • Rich Bleser richard.bleser@marsh.com