Download
1 / 35
360 likes | 579 Vues
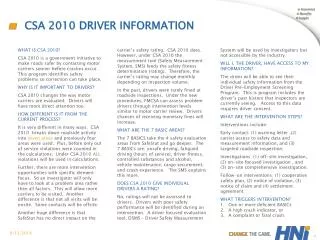
Comprehensive Safety Analysis CSA 2010 . January 28, 2009. Briefing Contents. What and why CSA 2010? A new operational model Potential benefits Operational model test Timeline Impact on motor carriers and drivers. What is CSA 2010?. High priority FMCSA safety initiative –

E N D
Comprehensive Safety AnalysisCSA 2010 January 28, 2009
Briefing Contents • What and why CSA 2010? • A new operational model • Potential benefits • Operational model test • Timeline • Impact on motor carriers and drivers 2
What is CSA 2010? • High priority FMCSA safety initiative – • To increase efficiency & effectiveness – compliance/enforcement • Ultimate Goal: Achieve greater reduction in large truck and bus fatalities 3
Why CSA 2010? • Current Operational Model Limitations • Limited investigative toolbox • Safety fitness ratings of today are tied to the on-site compliance review with very little roadside performance consideration • Result: We assess only a small fraction of industry • Focus is on carriers 5
CSA 2010 - A New Operational Model • Three major elements --- • Measurement • Interventions • Safety Fitness Determination 6
Measurement System Concept Measure performance of an entity in each Behavior Analysis & Safety Improvement Categories (BASICs) • Methodology designed to weight on-road safety data based on its relationship to crash risk • Focuses on safety behaviors that lead to crashes 7
BASIC Data Safety Event Data Sorted by BASIC • Unsafe Driving (Parts 392 & 397) • Fatigued Driving (HOS) (Parts 392 & 395) • Driver Fitness (Parts 383 & 391) • Controlled Substances /Alcohol (Part 392) • Vehicle Maintenance (Parts 393 & 396) • Improper Loading/Cargo Securement (Parts 392, 393, 397 & HM) • Crash Indicator 9
Example Carriers Under the Radar with Existing SafeStat System:
1111 Carrier A 111 A St. 111 A St. 111-111-1111 Carrier A 12
Driver 1 Driver 2 Driver 3 Driver 4 Driver 5 Driver 6 Driver 7 Driver 8 Carrier A: Inspections w/ Driver Fitness Violations 15
Driver 1 Driver 2 Driver 3 Driver 4 Driver 5 Driver 6 Driver 7 Driver 8 Driver 9 Driver 10 Driver 11 Driver 12 18
Driver 2 Driver 2 123456 Carrier A Carrier B Carrier C Carrier D 19
Driver 2 123456 Driver 2: Unsafe Driving Measure and Violations 20
Carrier A Carrier B Carrier B Carrier C Carrier C Carrier C Carrier D Carrier D Driver 2: Inspections w/ Unsafe Driving Violations 21
Today’s Model SFD tied to compliance review Satisfactory, Conditional, or Unsatisfactory SFD effective until next CR SFD based on acute/critical violations CSA 2010 SFD tied to performance data; not necessarily CR Continue Operation, Marginal, or Unfit SFD assigned to all carriers with sufficient data; updated regularly SFD based on violations of all safety regulations Safety Fitness Determination (SFD) 23
Uniformity of Roadside Inspection and Violation Data Commercial Vehicle Safety Alliance goals Ensure uniform and reciprocal application of North American Standard Inspection Procedures and North American Standard Out-of-Service Criteria. Promote the collection and use of accurate real time data to drive commercial motor vehicle enforcement programs. 26 26
Clean inspections are just as valuable as inspections with multiple violations Documents carrier improvement Impacts resource usage and carrier SFD All inspections must be uploaded and uniform 27 27
Performance based data Data-driven traffic safety programs are the future and will be the standard of effectiveness that other programs are measured against Effective, accurate and uniform data is critical for effective crash reduction strategies that will result in saving lives on our highways 28 28
CSA 2010 Operational Model Test • Purpose --- Why test? • Validate new operational model • Validate intervention process • Determine efficiency and safety effectiveness 29
CSA 2010 Operational Model Test • 30 months – Jan-2008 to Jun - 2010 • Phase I – Startup Jan-08 • Phase II – Fully Operational Oct-08 • UMTRI evaluation • 4 States: CO, GA, MO, and NJ • 28 safety investigators state and federal • Carriers domiciled in 4 states randomly split into two groups: ~ 34,000 each • Test group and control group • No regulatory relief in test group (enforcement/ratings) 30
Status & Target Dates • Team deployed May 2005 • Completed developmental work by December 2007 • Currently in test & validation phase • Deploy carriers by 2010. Drivers in reauthorization. CSA Team Initiated DOT Reauthorization Today * 2005 2006 2007 2008 2009 2010 Concept Development Test & Validate Deploy Add States 31
Carrier Feedback • Surprised they have received FMCSA attention • Appreciation that problem is brought to their attention before it’s “too late” • Interest in knowing how they are being evaluated and appreciation for the data available • Taking immediate action to rectify problem • Appreciation for off-sites (carriers that have had a CR) • Those with no prior contact with FMCSA are cautious • 2,374 warning letters sent out through December • 1,109 (47 percent) logged into CSI to examine their data 32
What Does This Mean for Carriers and Drivers? • All safety violations at roadside considered • Safety fitness updated every 30 days • All carriers with sufficient data • Broader array of less time-consuming interventions • Poor safety performance = greater likelihood of being contacted • Increased emphasis on CMV drivers • Crash accountability will be determined 33
CSA 2010 Potential Benefits • Maximize effectiveness of resources • Correct unsafe behavior early • Assess larger segment of industry • Achieve Goal: Greater reduction in large truck and bus related fatalities 34
More Information • For more information – or to submit questions or comments, please visit our Web site: www.fmcsa.dot.gov/csa2010 35