Download
1 / 9
120 likes | 281 Vues
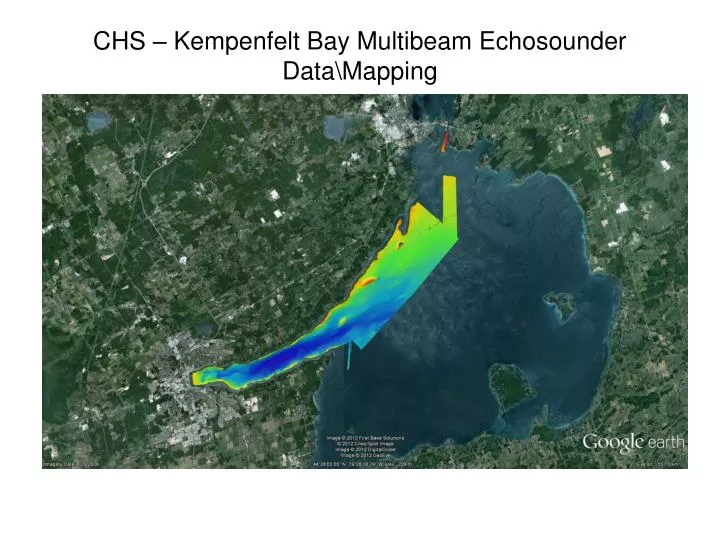
CHS – Kempenfelt Bay Multibeam Echosounder DataMapping. Canadian Hydrographic Multibeam Echosounder data. Strawberry Island and Shoal. Lake Simcoe Substrate Mapping. Most of the lake has been mapped using a 2 km grid.

E N D
Canadian Hydrographic Multibeam Echosounder data Strawberry Island and Shoal
Lake Simcoe Substrate Mapping Most of the lake has been mapped using a 2 km grid. Higher density sampling was undertaken for Kempenfelt Bay, Strawberry Island\Shoal and Georgina Island Acoustic data have been edited and sediment samples for ground truthing are being processed.
Survey Effort 189,487 dual frequency sounding Sediment layer of interest is between the lake bottom and the depth of the first horizon in the sediment profile 22 sediment cores were collected to determine phosphorus concentration profiles
High-frequency return Lake bottom Low-frequency return Bottom of first (contemporary) sediment layer Sediment Thickness: (LF depth-HF depth) 21.31-18.66=2.65m
Map of the Thickness of the Contemporary Sediment layer model of sediment thickness of the sediment layer ranging from 0.05 to 4.5 m Also shown are the locations of the core sites used to measured sediment concentration profiles of total phosphorus and other constituents Data have been edited and ingressed into GIS Model development to estimate in situ mass is ongoing
Collection of Sediment Cores Cores were collected at 22 sites during the winter (February, 2011)
Sediment Concentration of Total Phosphorus Concentration grouped by core intervals indicate concentrations are spread over a wide range Surface concentrations (0-5 cm) are comparable for all of Cook’s Bay (below) South to North