Download
1 / 29
301 likes | 482 Vues
GEO 241: Geographic Information Systems I. Week 3 : Cartographic Principles: Classifications Coordinate Systems Map Projections. Classification.

E N D
GEO 241: Geographic Information Systems I Week 3: Cartographic Principles: Classifications Coordinate Systems Map Projections Geographic Information Systems I | Department of Geography, DePaul University. Nandhini Gulasingam
Classification • Used for quantitative (numeric) data • Classification places attribute values into groups • Two key factors for classifying your data: 1. Classification type e.g. Natural breaks, manual breaks, standard deviation 2. Number of classes e.g. class size of 4 or 5 Geographic Information Systems I | Department of Geography, DePaul University. Nandhini Gulasingam 2
Classification • - Natural Breaks (Default) • Manual • Standard Deviation • - Equal Interval • - Defined Interval • - Quantile • Geometrical interval • Classification types : • Most commonly used classifications • Natural Breaks (Default) • Manual • Standard Deviation Geographic Information Systems I | Department of Geography, DePaul University. Nandhini Gulasingam 3
Classification Terminology # of Classes : 5 Class interval : Class boundary. The lower and upper limits Geographic Information Systems I | Department of Geography, DePaul University. Nandhini Gulasingam 4
Classification Classification types : Natural breaks (Jenks) • Default Method • Classes are based on natural groupings • Good for • mapping data values that are not evenly distributed because it places cluster values in the same class • Data that you are not familiar with (to identify clusters) Geographic Information Systems I | Department of Geography, DePaul University. Nandhini Gulasingam 5
Classification Geographic Information Systems I | Department of Geography, DePaul University. Nandhini Gulasingam 6
Classification Emphasize ranges – Low, moderate, high income levels Manually specify upper/lower limits Classification types : Manual breaks • Classification scheme where you specify your own class intervals • Comparing features to specific, meaningful values • Manually specify the upper and lower limit for each class • You may also manually classify data to emphasize a particular range of values, such as those above or below a threshold value. Geographic Information Systems I | Department of Geography, DePaul University. Nandhini Gulasingam 7
Classification Can we compare these two maps? Why / Why not? Geographic Information Systems I | Department of Geography, DePaul University. Nandhini Gulasingam 8
Classification Ans: The class ranges and # of class should match, use manual breaks to modify the ranges Geographic Information Systems I | Department of Geography, DePaul University. Nandhini Gulasingam 9
Classification Classification types : Standard deviation • Shows distribution above and below the mean • Good to locate atypical values • Useful to map the deviation from the norm e.g. crime, disease • It doesn’t show the actual value of the features, only how far their value is from the mean Geographic Information Systems I | Department of Geography, DePaul University. Nandhini Gulasingam 10
Classification Geographic Information Systems I | Department of Geography, DePaul University. Nandhini Gulasingam 11
Classification Geographic Information Systems I | Department of Geography, DePaul University. Nandhini Gulasingam 12
Classification Few things to remember about classification • How you choose to define class ranges and breaks will determine which features fall into which class • By changing the class and/or ranges, you can create maps that look different even though you use the same data • Generally, the goal is to make sure that features with similar values are in the same class • Where do you specify classification in ArcMap? • Under Symbology Quantities Classify (button) pick the classification type Geographic Information Systems I | Department of Geography, DePaul University. Nandhini Gulasingam 13
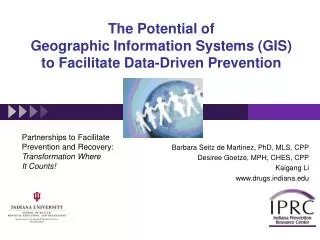
Cartographic Principles: Georeferencing Geographic Information Systems I | Department of Geography, DePaul University. Nandhini Gulasingam 14 What is Georeferencing? • In GIS, data is referenced to a location on the earth’s surface • When representing real-world features, you need to reference data to the correct location • The process of linking data to the physical location is known as georeferencing
Cartographic Principles: Georeferencing Chicago Public School (CPS) Locations Data located incorrectly CCA shape & size distorted Data located correctly, size/shape not distorted Geographic Information Systems I | Department of Geography, DePaul University. Nandhini Gulasingam 15
Cartographic Principles: Georeferencing Geographic Information Systems I | Department of Geography, DePaul University. Nandhini Gulasingam 16 Why Georeferencing? • If data is not located correctly, or if their shape or size is distorted, then your mapping and spatial analysis will yield incorrect results • So, without properly "georeferencing" all your GIS data to a standard coordinate and projection system, your data will essentially be useless! • Coordinate Systems and MapProjections are the most crucial concepts to grasp Georeferencing is accomplished using Coordinate System and Map Projections
Cartographic Principles: Coordinates & Map Projections Geographic Information Systems I | Department of Geography, DePaul University. Nandhini Gulasingam 17 Coordinate Systems: Why do we need a coordinate systems? • GIS layers having different coordinate systems will not overlay properly on top of one another • GIS data need to be located properly in geographic space in order to be used in mapping and spatial analysis • Coordinate systems are used to reference the features on a map to the actual locations of the objects they represent on the surface of the earth
Cartographic Principles: Coordinates & Map Projections (Contd.) Geographic Information Systems I | Department of Geography, DePaul University. Nandhini Gulasingam 18 Coordinate Systems: • Coordinate systems can be represented in two ways: 1. Geographic coordinate system: A measurement of a location on the earth's surface expressed in degrees of latitude and longitude 2. Projected coordinate system: A measurement of locations on the earth's surface expressed in a two- dimensional system. It locates features using x (horizontal) and y (vertical) axis
Cartographic Principles: Coordinates & Map Projections (Contd.) Example: Lat/Long and X/Y coordinates for 1 E Jackson Blvd, Chicago, IL Latitude / Y Longitude / X Coordinate Systems: Geographic Information Systems I | Department of Geography, DePaul University. Nandhini Gulasingam 19
Cartographic Principles: Coordinates & Map Projections (Contd.) Geographic Information Systems I | Department of Geography, DePaul University. Nandhini Gulasingam 20 Map Projections: • The spherical surface (3D) of the earth is shown on flat maps with the help of projections. • The earth is reduced to the size of a globe with the scale equal to the desired flat map. All spatial properties are true to those on the earth. • Then the globe is flattened. Since this cannot be done without distortion, certain spatial properties are preserved. • Spatial properties include area, shape/angel, distance or direction
Cartographic Principles: Coordinates & Map Projections (Contd.) Geographic Information Systems I | Department of Geography, DePaul University. Nandhini Gulasingam 21 Map Projections: • When transforming the features/data from a 3D globe to a 2D flat planar map spatial distortion occurs • These distortions can be either area, shape, distance or angle • Map projection is used to preserve these distortions • Map projections can preserve only one property • Area (Equivalent) • Angle / Shape (Conformal) • Distance (Equidistant) • Direction (Azimuthal)
Cartographic Principles: Coordinates & Map Projections (Contd.) Peters Map Projections: Types (1) Equal Area • Preserves area • Many thematic maps that need area to be preserved uses this projection • e.g. of projection type: Peters • When should you use equal area projections? • Population per square mile area • Pollution/deforestation • Crop yielding • Greenhouse warming Geographic Information Systems I | Department of Geography, DePaul University. Nandhini Gulasingam 22
Cartographic Principles: Coordinates & Map Projections (Contd.) Mercator Map Projections: Types (2) Conformal: • Preserves shape and angle • Shape is preserved only for small areas • e.g. of projection types: Lambert, Mercator • When should you use conformal projections? • Navigational charts • Weather maps Geographic Information Systems I | Department of Geography, DePaul University. Nandhini Gulasingam 23
Cartographic Principles: Coordinates & Map Projections (Contd.) Geographic Information Systems I | Department of Geography, DePaul University. Nandhini Gulasingam 24 Map Projections: Types (3) Equidistant: • Preserves distances • Useful to find features that are within a certain distance of other features • When should you use equidistant projections? • Environmental (e.g. distance from oil spill to affected areas) • To show air-route distances
Cartographic Principles: Coordinates & Map Projections (Contd.) Geographic Information Systems I | Department of Geography, DePaul University. Nandhini Gulasingam 25 Map Projections: (4) Azimuthal • Preserves direction • This can be combined with equal area, conformal, and equidistant projections • e.g. of projection types: Lambert Equal Area Azimuthal and the Azimuthal Equidistant projections • When should you use azimuthal projections? • navigation (air, land, water)
Cartographic Principles: Coordinates & Map Projections (Contd.) Geographic Information Systems I | Department of Geography, DePaul University. Nandhini Gulasingam 26 Map Projections: (5) Other • e.g. of projection type: Robinson. It is neither equal area nor conformal but is aesthetically pleasing and useful for general mapping • Where do you see these? Most commercially created world maps
Cartographic Principles: Coordinates & Map Projections (Contd.) Geographic Information Systems I | Department of Geography, DePaul University. Nandhini Gulasingam 27 Map Projections: How to decide what type of map projection to use? • Use / purpose of map • Scale or area to be shown • Property that is critical to preserve
Lab 3 • Experiment with different types of classification methods, and map projections • Select the best classification type and map projection • Interpret the maps Geographic Information Systems I | Department of Geography, DePaul University. Nandhini Gulasingam 28
Next Week (Week 4) Assignment 3 due Friday midnight Geographic Information Systems I | Department of Geography, DePaul University. Nandhini Gulasingam 29