Download
1 / 139
1.43k likes | 1.7k Vues
Geographic Data and Relationships. Outline Types of Geographic Data spatial data tabular data image data Acquiring Data Storing Geographical data Spatial Data Models and Structures Vector data model spaghetti topological data structures (concepts of topology) Raster data model

E N D
Outline • Types of Geographic Data • spatial data • tabular data • image data • Acquiring Data • Storing Geographical data • Spatial Data Models and Structures • Vector data model • spaghetti • topological data structures (concepts of topology) • Raster data model • Database Structures • Referencing Spatial Data and Map Projections
Types of Geographic Data • Geographic data: data that describes any part of the Earth's surface or the features found on it such as: cartographic data, scientific data, business data, land records, photographs, customer databases, travel guides, real estate listings, legal documents, videos, etc. • ArcView supports three types: • Spatial data. • Images. • Tabular (Descriptive) data.
Spatial Data • Spatial data is geographic data that stores the geometriclocation of particular features, along with attribute information describing what these features represent. Also known as a digital map. • location data is stored in a vector or raster data structure. • Corresponding attribute data is stored in a set of tables related geographically to the features they describe. • Location, shape, tables, and the rest of the attributes together form what we call “spatial data”
Spatial Data Format Supported by ArcView • ArcView shapefiles • ARC/INFO coverages • ARC/INFO GRID data • Image data • CAD drawings • SDE data (If Database Access is installed) • StreetMap data (If StreetMap is installed) • TINs (If 3D Analyst is installed) • VPF data
Example of themes imported from AutoCad by “Cad Reader” in ArcView
Differences between Spatial Data and Simple Vector Graphics or Images What is the difference between spatial data and a scanned image or a CAD file?? 1- In spatial data there is an explicit relationship between the geometric and attribute information, so that both are always available when you work with the data. For example, if you select particular features displayed on a view. ArcView will automatically highlight the records containing the attributes of these features when the attribute table is displayed.
Streets selected on the map of SF are also selected in the table
2- Spatial data is georeferenced to known locations on the Earth's surface. • 3- Spatial data is organized thematically into different layers, or themes. There is one theme for each set of geographic features or phenomena for which information will be recorded. For example, streams, land use, elevation, and buildings will each be stored as a separate spatial data sources, rather than trying to store them all together in one layer. Coordinates
4- Spatial data is primarily feature based. It is designed to enable specific geographic features and phenomena to be managed, manipulated and analyzed easily and flexibly.
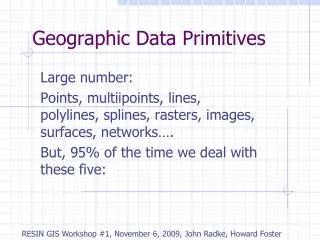
1- Vector Data • Usually constructed by digitizing a map or a photograph. • Features are represented by pairs of Cartesian coordinates. They can be points, lines, or polygons. • Point features: are represented by discrete locations defining a map object whose boundary or shape is too small to be shown as a line or area feature. A special symbol or label usually depicts a point location. Examples of such features are wells and telephone poles
Line features: are sets of ordered coordinates that, when connected, represent the linear shapes of map objects too narrow to be displayed by areas such as roads and streams. Line features can also represent features that has no width such as contours. Line features can be referred to as arcs or links. • Area features: an area feature is a closed figure whose boundary encloses a homogenous area, such as a state or a water body • Geographic boundaries often come with area and perimeter calculated. Street data often include address ranges along each street. • Graphics can be used to represent attributes using symbols. Roads can be drawn with different line widths or colors. School location can be represented by a special symbol.
In vector representation, each points is recorded as a single x, y location. Lines (arcs, or links) are recorded as a series of ordered x,y. Areas are recorded as a series of x,y coordinates defining arcs that enclose the area, first and last points are the same in this case. Areas can also be defined by the arcs around their boundaries, see figures. • This way, features are stored in terms of pairs of x,y coordinates instead of storing a graph. • Multiple features are represented by assigning an ID to each feature and list the pairs of coordinates against feature ID.
------ ---------
2- Tabular (Descriptive) Data • Tabular data can include almost any data set, whether or not it contains geographic data. • Can be displayed: • on the view directly (by hyper linking?); or • asdescriptive (attribute) data that GIS links to map features. • Can be linked to map features through unique ID_s of the features • Often comes packaged with featured data. • May include description of locations by address or by coordinates for example.
Description of locations in tables can be displayed graphically. You can use a symbol to display the locations of bird nests or airport locations for example
Often stored in abbreviated way. A data dictionary describes the data not just full names. Very important to obtain a data dictionary when acquiring descriptive data
An ArcView map references the tabular data source it represents, but doesn't contain the tabular data itself. This means that tables are dynamic, because they reflect the current status of the source data they are based on. If the source data changes, a table based on this data will automatically reflect the change the next time you open the project containing this table. Data frames are also updated. • Formats supported by ArcView: • Data from database servers such as Oracle, Ingres, Sybase, Informix, etc. • dBASE III files • dBASE IV files • INFO tables • Text files with fields separated by tabs or commas
3- Image Data • Image data includes satellite images, aerial photographs, and other remotely sensed or scanned data • Image data is a form of raster data where each grid-cell, or pixel, has a certain value depending on how the image was captured and what it represents. For example, if the image is a remotely sensed satellite image, each pixel represents light energy reflected from a portion of the Earth's surface. If, however, the image is a scanned document, each pixel represents a brightness value associated with a particular point on the document. ArcGIS refers to rasters as “surfaces” • Can be used as maps for analysis, background of a view or a map display, or as attributes linked to features.
Aerial photograph used as a map in the background Notice that locations of samples are displayed
ArcView -without extensions- supports images for display and attribute purposes only. They cannot be used for analysis since they are not feature based. In order to be able to create and analyze image data, “Spatial Analyst” must be added to ArcView. • ArcMap can handle raster data deeper. Images can be georefrenced and classified. • Scanned images used as attributes can also represent scanned text document such as permits.
ArcView supports the following image formats as themes: • ARC Digitized Raster Graphics (ADRG) (if ArcView's ADRG Image Support extension is loaded) • BMP • BSQ, BIL and BIP • Compressed ARC Digitized Raster Graphics (CADRG) (if ArcView's CADRG Image Support extension is loaded) • Controlled Image Base (CIB) (if ArcView's CIB Image Support extension is loaded) • ERDAS • GRID
IMAGINE (if ArcView’s IMAGINE image extension is loaded) • IMPELL Bitmaps (Run-length compressed files) • Image catalogs • JPEG (if ArcView’s JPEG image extension is loaded) • MrSID (if ArcView’s MrSID image extension is loaded) • National Image Transfer Format (NITF) (if ArcView's NITF Image Support extension is loaded) • Sun rasterfiles • TIFF • TIFF/LZW compressed
ArcView supports hot linking to the following image formats: (Notice that JPG is not supported in Version 3.1 but supported in ArcGIS) • GIF (Graphics Interchange Format) • MacPaint • Microsoft DIB (Device-Independent Bitmap) • Sun raster files • TIFF (Tag Image File Format) • TIFF/LZW compressed • X-Bitmap (generated by ‘bitmap' utility on X Windows) • XWD (X Windows Dump Format)
Acquiring Data • Certain considerations before acquiring data: (refer to attached sheet) • Area: consider an area that is not much larger and is not smaller than the area under study • Scale: the same feature is displayed differently at different scales. Roads can be lines or areas. Schools can be points or areas. Acquire data at a scale that fits your needs. • Time: some data change with time. If this is the case, make sure you obtain data at the time you want to consider. • Accuracy: location of roads within 40 ft is OK for traveling information but not for planning.
Description: must obtain a data dictionary with the data, see attached data dictionary • Compatibility: the format of the data need to be supported by the software you are using. If not, it can be used only if you have a way of transforming the data into a format you can use.
Sources of data: 1- Governmental agencies provide them for a minimum charge. 2- UW libraries have a huge collection of all sorts of data. Some of them are available on CD’s and some are available online. Check the sites: www.lib.washington.edu/maps/digdata.html wagda.lib.washington.edu {data for King County, Seattle, and WA state} wa-node.gis.washington.edu 3- Vendors: all types of data at different scales are available for purchasing.
4- The World Wide Web, became a very important source for free data check (www.esri.com), see attached sheet 5- Users: users can create their own data by: 1- digitizing from maps or images digitizing is the process of manually converting hard copy maps into digital format for use by a computer.
Digitizers have their own internal coordinate systems, up to 0.025mm, which may be related to terrain coordinates by cross-registering
At least three points with known terrain coordinates. After registering the points, a cross hair or cursor is placed over the position to be recorded and a key is pressed.
Digitizing includes the entry of thematic codes for object types and ID codes which link the object type to attribute data. For example, digitizing a building includes entry of the thematic codes for buildings and ID number for a building. A new ID number is entered for the next building, and so on.
2- drawing over maps or images • 3- from tables: features can be mapped based on their locations in tables, usually using symbols. Address geocoding helps translates addresses in tables into coordinates for display on maps. • 4- typing attribute tables.
Storing Geographic Data • A digital map database consists of two types of information: spatial and descriptive data. • The computer stores a series of files that contain either type • The power of GIS lies in its ability to link the two types of data and maintain the spatial relationship between the map features (what is next to what?) • Tabular data can be accessed from the map and can be used to create maps. For example, you can change the classification (colors) according to different attributes.
Representing Maps in the Computer • Features are represented by (points, lines or areas) or cells. • Features are referenced to ground locations through a two dimensional flat Cartesian system. • Spatial Data Models and Structures • Vector • Raster (surface in ArcGIS) • Database (tables)