Download
1 / 121
1.21k likes | 1.35k Vues
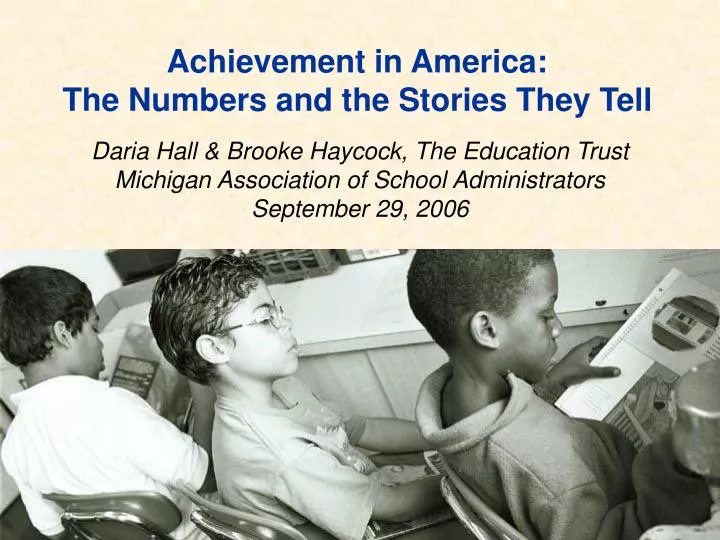
Achievement in America: The Numbers and the Stories They Tell. Daria Hall & Brooke Haycock, The Education Trust Michigan Association of School Administrators September 29, 2006. What are the trends in student achievement over time?. National Assessment of Educational Progress.

E N D
Achievement in America: The Numbers and the Stories They Tell Daria Hall & Brooke Haycock, The Education Trust Michigan Association of School Administrators September 29, 2006
What are the trends in student achievement over time? National Assessment of Educational Progress
NAEP Reading, 9 Year-Olds:Record Performance for All Groups Source: National Center for Education Statistics, NAEP 2004 Trends in Academic Progress
African American-White Gap Narrows to Smallest Size in HistoryNAEP Reading, 9 Year-Olds 26 35 29 Source: National Center for Education Statistics, NAEP 2004 Trends in Academic Progress
Latino-White Gap Narrows to Smallest Size in HistoryNAEP Reading, 9 Year-Olds 21 28 24 Source: National Center for Education Statistics, NAEP 2004 Trends in Academic Progress
NAEP Math, 9 Year-Olds: Record Performance for All Groups Source: National Center for Education Statistics, NAEP 2004 Trends in Academic Progress
African American-White Gap Narrows to Smallest Size in HistoryNAEP Math, 9 Year-Olds 23 28 25 Source: National Center for Education Statistics, NAEP 2004 Trends in Academic Progress
Latino-White Gap Narrows to Smallest Size in HistoryNAEP Math, 9 Year-Olds 17 26 21 Source: National Center for Education Statistics, NAEP 2004 Trends in Academic Progress
NAEP Reading, 13 Year-Olds Source: National Center for Education Statistics, NAEP 2004 Trends in Academic Progress
African American-White GapNAEP Reading, 13 Year-Olds 18 29 22 Source: National Center for Education Statistics, NAEP 2004 Trends in Academic Progress
Latino-White Gap NAEP Reading, 13 Year-Olds 24 21 23 Source: National Center for Education Statistics, NAEP 2004 Trends in Academic Progress
NAEP Math, 13 Year-OldsRecord Performance for All Groups Source: National Center for Education Statistics, NAEP 2004 Trends in Academic Progress
African American-White GapNAEP Math, 13 Year-Olds 26 32 25 Source: National Center for Education Statistics, NAEP 2004 Trends in Academic Progress
Latino-White Gap NAEP Math, 13 Year-Olds 23 24 20 Source: National Center for Education Statistics, NAEP 2004 Trends in Academic Progress
NAEP Reading, 17 Year-Olds Source: National Center for Education Statistics, NAEP 2004 Trends in Academic Progress
African American-White GapNAEP Reading, 17 Year-Olds 21 29 31 Source: National Center for Education Statistics, NAEP 2004 Trends in Academic Progress
Latino-White GapNAEP Reading, 17 Year-Olds 22 24 29 Source: National Center for Education Statistics, NAEP 2004 Trends in Academic Progress
NAEP Math, 17 Year-Olds Source: National Center for Education Statistics, NAEP 2004 Trends in Academic Progress
African American-White Gap NAEP Math, 17 Year-Olds 32 20 28 Source: National Center for Education Statistics, NAEP 2004 Trends in Academic Progress
Latino-White GapNAEP Math, 17 Year-Olds 22 24 20 Source: National Center for Education Statistics, NAEP 2004 Trends in Academic Progress
Where do we stand now? National Assessment of Educational Progress
2005 NAEP Grade 4 ReadingAll Students, Nation Source: National Center for Education Statistics, NAEP Data Explorer, http://nces.ed.gov/nationsreportcard/nde/
Students at the basic level in grade 4 reading can • Recognize literal information from text • Identify traits describing a passage’s main character Source: National Center for Education Statistics, NAEP item map, http://www.nces.ed.gov/natiosreportcard/
2005 NAEP Grade 4 Readingby Race/Ethnicity, Nation Source: National Center for Education Statistics, NAEP Data Explorer, http://nces.ed.gov/nationsreportcard/nde/
2005 NAEP Grade 4 Readingby Family Income, Nation Source: National Center for Education Statistics, NAEP Data Explorer, http://nces.ed.gov/nationsreportcard/nde/
2005 NAEP Grade 8 MathAll Students, Nation Source: National Center for Education Statistics, NAEP Data Explorer, http://nces.ed.gov/nationsreportcard/nde/
Students at the basic level in grade 8 math can • Solve a story problem with multiple operations • Draw the reflection of a figure Source: National Center for Education Statistics, NAEP item map, http://www.nces.ed.gov/natiosreportcard/
2005 NAEP Grade 8 Mathby Race/Ethnicity, Nation Source: National Center for Education Statistics, NAEP Data Explorer, http://nces.ed.gov/nationsreportcard/nde/
2005 NAEP Grade 8 Mathby Family Income, Nation Source: National Center for Education Statistics, NAEP Data Explorer, http://nces.ed.gov/nationsreportcard/nde/
African American and Latino 17 Year-Olds Do Math at Same Levels As White 13 Year-Olds Source: National Center for Education Statistics, NAEP 2004 Trends in Academic Progress
African American and Latino 17 Year-Olds Read at Same Levels As White 13 Year-Olds Source: National Center for Education Statistics, NAEP 2004 Trends in Academic Progress
Of Every 100 Students in 9th Grade… • 89 will make it to 10th grade • 81 will make it to 11th grade • 75 will make it to 12th grade • 70 will graduate on-time Source: Ed Week, EPE Research Center, Diploma Counts 2006, uses the Cumulative Promotion Index (CPI).
And outcomes are much worse for some groups of studentsOn-Time High School Graduation, Class of 2003 Source: Ed Week, Diploma Counts 2006, uses the Cumulative Promotion Index (CPI).
Where does Michigan stand? National Assessment of Educational Progress
2005 NAEP Grade 4 ReadingAll Students, Michigan Source: National Center for Education Statistics, NAEP Data Explorer, http://nces.ed.gov/nationsreportcard/nde/
2005 NAEP Grade 4 Readingby Race/Ethnicity, Michigan Source: National Center for Education Statistics, NAEP Data Explorer, http://nces.ed.gov/nationsreportcard/nde/
2005 NAEP Grade 4 Readingby Family Income, Michigan Source: National Center for Education Statistics, NAEP Data Explorer, http://nces.ed.gov/nationsreportcard/nde/
2005 NAEP Grade 8 MathAll Students, Michigan Source: National Center for Education Statistics, NAEP Data Explorer, http://nces.ed.gov/nationsreportcard/nde/
2005 NAEP Grade 8 Mathby Race/Ethnicity, Michigan Source: National Center for Education Statistics, NAEP Data Explorer, http://nces.ed.gov/nationsreportcard/nde/
2005 NAEP Grade 8 Mathby Family Income, Michigan Source: National Center for Education Statistics, NAEP Data Explorer, http://nces.ed.gov/nationsreportcard/nde/
MichiganOn-Time High School Graduation RateClass of 2003 Source: Editorial Projects in Education, Diplomas Count: An Essential Guide to Graduation Policy and Rates, 2006
NAEP 2005 Grade 4 Reading, Overall Scale Scores Source: National Center for Education Statistics, NAEP Data Explorer, http://nces.ed.gov/nationsreportcard/nde
NAEP 2005 Grade 4 Reading, African American Scale Scores Source: National Center for Education Statistics, NAEP Data Explorer, http://nces.ed.gov/nationsreportcard/nde
NAEP 2005 Grade 4 Reading, Low-Income Scale Scores Source: National Center for Education Statistics, NAEP Data Explorer, http://nces.ed.gov/nationsreportcard/nde