Download
1 / 17
170 likes | 174 Vues
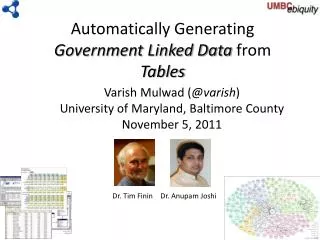
This paper discusses a completely automated approach for generating linked data by inferring the semantics of tables. It explores the use of DBpedia and RDF to link tables to relevant entities and classes. The paper also addresses challenges such as interpreting literals and providing context using associated documents.

E N D
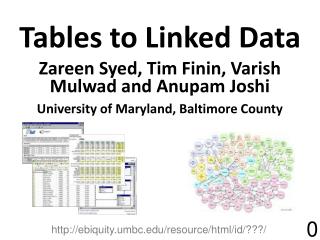
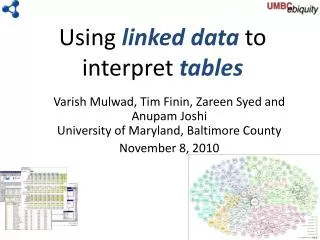
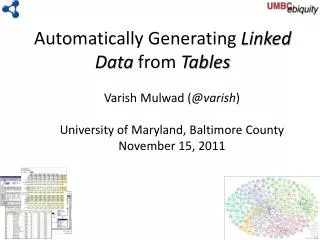
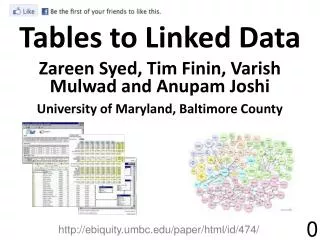
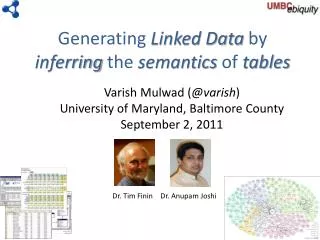
Generating Linked Databy Inferring theSemantics of TablesVarish Mulwad, Ph.D. 2015 http://ebiq.org/j/96
Goal: Table => LOD* http://dbpedia.org/class/yago/NationalBasketballAssociationTeams dbprop:team http://dbpedia.org/resource/Allen_Iverson Player height in meters * DBpedia
Goal: Table => LOD* @prefix dbpedia: <http://dbpedia.org/resource/> . @prefix dbo: <http://dbpedia.org/ontology/> . @prefix yago: <http://dbpedia.org/class/yago/> . "Name"@en is rdfs:label of dbo:BasketballPlayer. "Team"@en is rdfs:label of yago:NationalBasketballAssociationTeams . "Michael Jordan"@en is rdfs:label of dbpedia:Michael Jordan . dbpedia:Michael Jordan a dbo:BasketballPlayer. "Chicago Bulls"@en is rdfs:label of dbpedia:Chicago Bulls . dbpedia:Chicago Bulls a yago:NationalBasketballAssociationTeams . RDF Linked Data All this in a completely automated way * DBpedia
Tables are everywhere !! … yet … The web – 154 millionhigh quality relational tables
Evidence–based medicine Evidence-based medicine judges the efficacy of treatments or tests by meta-analyses of clinical trials. Key information is often found in tables in articles # of Clinical trials published in 2008 # of meta analysis published in 2008 However, the rate at which meta-analyses are published remains very low … hampers effective health care treatment … Figure: Evidence-Based Medicine - the Essential Role of Systematic Reviews, and the Need for Automated Text Mining Tools, IHI 2010
2010 Preliminary System T2LD Framework Predict Class for Columns Linking the table cells Identify and Discover relations Class prediction for column: 77% Entity Linking for table cells: 66% Examples of class label prediction results:Column – NationalityPrediction – MilitaryConflict Column – Birth PlacePrediction – PopulatedPlace
Sources of Errors • The sequential approach let errors perco-late from one phase to the next • The system was biased toward predicting overly general classes over more appropriate specific ones • Heuristics largely drive the system • Although we consider multiple sources of evidence, we did not joint assignment
A Domain Independent Framework Pre-processing modules Sampling Acronym detection Query and generate initial mappings 1 2 Joint Inference/Assignment Generate Linked RDF Verify (optional) Store in a knowledge base & publish as LOD
Query Mechanism {dbo:Place,dbo:City,yago:WomenArtist,yago:LivingPeople,yago:NationalBasketballAssociationTeams…} Chicago Bulls, Chicago, Judy Chicago … ……… possible entities possible types
Ranking the candidates Class from an ontology String in column header String similarity metrics
Ranking the candidates String in table cell Entity from the knowledge base (KB) String similarity metrics Popularity metrics
Joint Inference overevidence in a table • Probabilistic Graphical Models
A graphical model for tablesJoint inference over evidence in a table Class C2 C3 C1 R21 R31 R11 R12 R22 R32 R13 R23 R33 Instance
Parameterized graphical model Captures interaction between row values R33 R11 R12 R13 R21 R22 R23 R31 R32 Row value Factor Node C2 C1 C3 Function that captures the affinity between the column headers and row values Variable Node: Column header Captures interaction between column headers
Challenge: Interpreting Literals Many columns have literals, e.g., numbers Age in years? Percent? Population? Profit in $K ? • Predict properties based on cell values • Cyc had hand coded rules: humans don’t live past 120 • We extract value distributions from LOD resources • Differ for subclasses: age of people vs. political leaders vs. athletes • Represent as measurements: value + units • Metric: possibility/probability of values given distribution
Other Challenges • Using table captions and other text is associated documents to provide context • Size of some data.gov tables (> 400K rows!) makes using full graphical model impractical • Sample table and run model on the subset • Achieving acceptable accuracy may require human input • 100% accuracy unattainable automatically • How best to let humans offer advice and/or correct interpretations?