Download
1 / 17
170 likes | 298 Vues
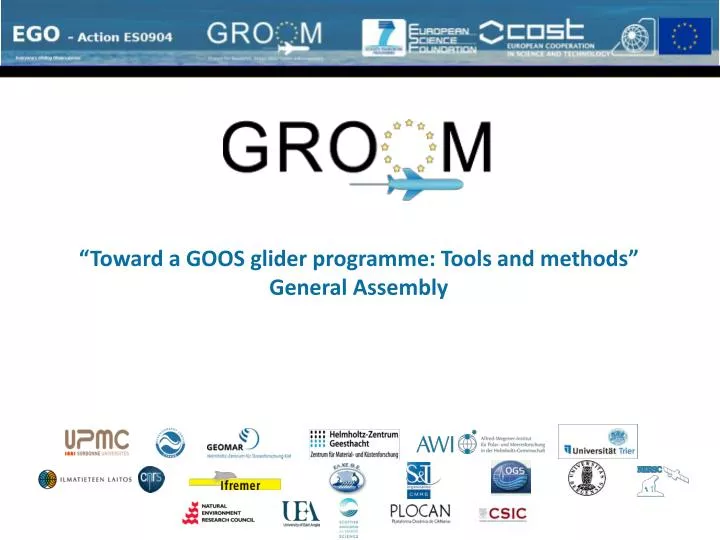
“Toward a GOOS glider programme: Tools and methods” General Assembly. Outline. Introduction Components for network design Results Homogeneous Networks Mediterranean Sea North Atlantic-Artic Ocean Atlantic Ocean Heterogeneous Networks Glider-Mooring Glider-Satellite

E N D
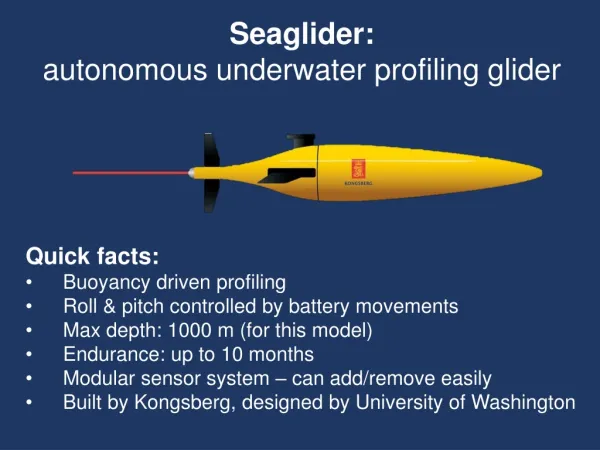
“Toward a GOOS glider programme: Tools and methods”General Assembly
Outline • Introduction • Components for network design • Results • Homogeneous Networks • Mediterranean Sea • North Atlantic-Artic Ocean • Atlantic Ocean • Heterogeneous Networks • Glider-Mooring • Glider-Satellite • Towards a ARGO-glider network component • Conclusion
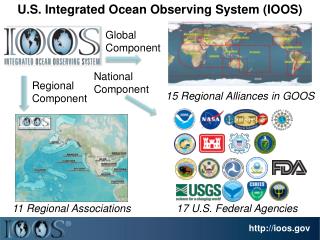
Introduction • GOOS is designed to: • Monitor, understand and predict weather and climate • Describe and forecast the state of the ocean, including living resources • Improve management of marine and coastal ecosystems and resources • Mitigate damage from natural hazards and pollution • Protect life and property on coasts and at sea • Enable scientific research • GOOS is made of many observation platforms: • 3000 Argo floats • 1250 drifting buoys • 350 embarked systems on commercial or cruising yachts. • 100 research vessels. • 200 marigraphs and holographs. • 50 commercial ships which launch probes. • 200 moorings in open sea. • Gliders? Glynn Gorick’s artwork depicting the GOOS observation network through its instrumentation and interconnections http://www.ioc-goos.org/
Introduction GOOS involves a heterogeneous ocean observing network involving static nodes (moored profilers, bottom mounted systems), nodes with uncontrolled motion (drifter buoys and profiling floats) and nodes with controlled motion (ships). This in situ observing system is complemented by remote sensing platforms/sensors (including acoustic, aerial or space based). Cooperation in a ocean observing network a performance gain in marine sampling over naïve collective behavior Nodes with controlled motion allow to substantially increase cooperation (coordination). Difficult to realize by traditional platforms of oceanographic sampling due to their physical, economic and/or operational limits. Gliders would increase cooperation levels in GOOS. Exploiting the observing capabilities of the different nodes must be found by designing optimum sampling strategies to allow an accurate representation of oceanographic processes (optimal sampling). These sampling strategies could adapt to the evolution of the environment, and consider possible limitations due to the motion of part of the platforms in the network (adaptive sampling). Multi-Robotic System Taxonomy
Components for network design Experimental Design Exploratory Design Optimum Design Base the design on a geometric criterion that not involves a priori knowledge of the environment. Space filling designs, try to spread sampling locations throughout the region, leaving as few holes as possible. Base the design on a prior knowledge of the environment. Optimization Models -Environment -Platform Cost
Components for network design Environment The sampled field is interpreted as a weakly stationary or second-order stationary process defined by known background field and covariance function ( stands for ensemble average). CM is computed from ensembles or spatiotemporal series of model outputs or observations. Trajectories Number of gliders Initial Position Speed Total mission time Time between waypoints Surface time b L=Tw*V L=Tw*(V+Vc) Currents g a
Components for network design Cost Function Field values at the grid nodes, Observation matrix, Observation error matrix Vector of observations A- Optimal Design
Components for network design Optimization Simulated Annealing Genetic Algorithm Pattern Search Random Perturbation Generate Population Generate Mesh Evaluation and Selection Compute change in cost function Poll Better? Compute probability of acceptance Reproduction Yes Mutation 8
Results: Networks of gliders Glider Ports Network Configuration 12 days mission 3 hours optimization for each month 2 days TW Glider speed 0.35 m/s Background statistics has been built on the basis of a time series from 1999 to 2011 of monthly reanalysis of the temperature fields at 50 m depth resulted form the Mediterranean Forecasting System (MFS). Numerical covariance estimated with a shinkrage approach Spatially average prior (black) and a posterior (blue) uncertainties Optimum glider tracks and posterior uncertainty-September Prior uncertainty- September
Results: Networks of gliders Glider Ports Network Configuration 12 days mission 3 hours optimization for each month 2 days TW Glider speed 0.35 m/s Background statistics has been built on the basis of a time series from 1999 to 2011 of monthly reanalysis of the temperature fields at 50 m depth resulted form the Mediterranean Forecasting System (MFS). Numerical covariance estimated with a shinkrage approach Spatially average prior (black) and a posterior (blue) uncertainties Optimum glider tracks and posterior uncertainty-September Prior uncertainty- September
Results: Networks of gliders Glider Ports Network Configuration 12 days mission 3 hours optimization for each month 2 days TW Glider speed 0.35 m/s Background statistics has been built on the basis of a time series from 2003 to 2008 of monthly reanalysis of the temperature fields at 50 m depth resulted from the Topaz ocean prediction system . Numerical covariance estimated with a shinkrage approach Spatially average prior (black) and a posterior (blue) uncertainties Optimum glider tracks and posterior uncertainty-October Prior uncertainty- October
Results: Networks of gliders Network Configuration 30 days mission Background statistics has been built on the basis of a time series from 20 years of monthly reanalysis of the temperature fields at 50 m depth resulted from Topaz ocean prediction system Numerical covariance estimated with a shinkrage approach
Results: Networks of gliders Network Configuration 10 days mission Background statistics has been built on the basis of a time series from 20 years of monthly reanalysis of the temperature fields at 50 m depth resulted from Topaz ocean prediction system Numerical covariance estimated with a shinkrage approach
Results: Networks of glider-moorings Optimum glider trajectory to get near-optimal temperature estimations in the first 200 m of the water column. The region selected was a rectangle of approximately 60 x 60 Km2 in the Ligurian Sea centered on the ODAS Italia1- W1M3A Eulerian observatory . Optimum mission designs for a glider were computed for the described area for August 20th -24th. A 30-day integration during August 2010 of the operational Navy Coastal Ocean Model (NCOM, Martin, 2010) is considered in this study. NCOM was coupled to the Navy Coupled Ocean Data Assimilation (NCODA) system. The time-evolving thermal field resulting from the 30-day simulation is considered as the ‘‘truth’’ from which glider and mooring data are simulated. Inferred temperature field August 20th -24th. Uncertainty of temperature field August 20th -24th. Truth temperature field August 20th -24th.
Results: Networks of glider-satellite Field Experiment Glider data Satellite data Glider data ----- Glider + satellite Glider data Glider + Satellite data
Conclusion Observational oceanography is transitioning from platform based capabilities to networks of sensor and platforms Cooperation and coordination are fundamental aspects of the networking paradigm Platforms which motion is controlled (eg. gliders) play a relevant role to implement cooperation in networks Gliders bring new scientific and technological demands into observational oceanography. Exploiting synergism between different ocean observing platforms Integrating the observations gathered by different platforms into a unique picture GROOM has developed models and methodologies to attempt to satisfy the above demand It is envisioned that the design of a ARGO-glider network in GOOS would be very significant