Download
1 / 52
520 likes | 629 Vues
Signalized Intersection Performance Measures. for SR 43 (River Road). West Lafayette, Indiana. Project Team. Natalie Villwock Joey Ernst Chris Day Ron Davis. 2. Outline. Corridor Overview (Natalie) Identifying and Installing New Equipment Management of Data Collection

E N D
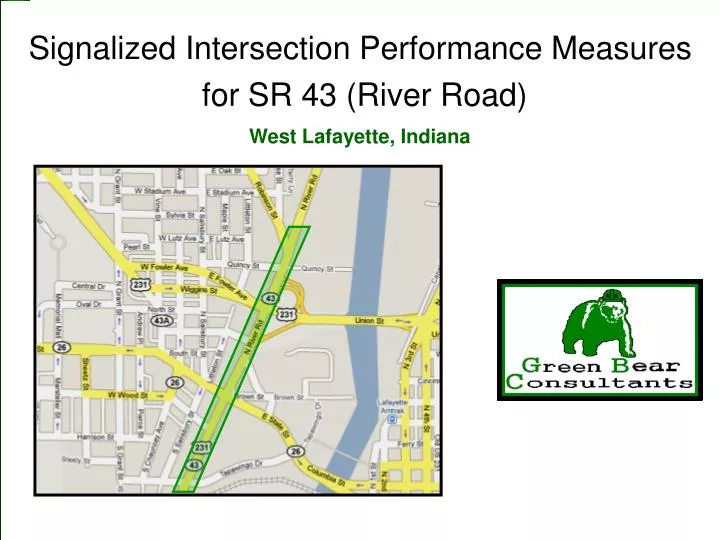
Signalized Intersection Performance Measures for SR 43 (River Road) West Lafayette, Indiana
Project Team • Natalie Villwock • Joey Ernst • Chris Day • Ron Davis 2
Outline • Corridor Overview (Natalie) • Identifying and Installing New Equipment • Management of Data Collection • Performance Measure Reports • Report Interpretation • Schedule • Cost • Risk • Conclusions 3
SR 43 and Robinson Loops existing for NB and SB left-turn, only Loops existing on both lanes for EB and WB Problem Signal heads for EB traffic may be confused by SB traffic Existing Traffic Signal Infrastructure 5
US 231 and Fowler (Salem) Off Ramp All WB lanes have loops There are no NB or SB loops There are no existing pedestrian buttons Problem Close proximity to US 231 and Quincey Existing Traffic Signal Infrastructure 6
US 231 and Wiggins (Union) Off Ramp Loops existing for both EB lanes No existing loops for NB or SB No existing pedestrian push-buttons Problem: SB signal heads may be disguised by bridge Existing Traffic Signal Infrastructure 7
US 231 and Howard No existing SB or NB loops for the through lanes Loops for both WB lanes Problem WB RT signal head may be confused with NB through Existing Traffic Signal Infrastructure 8
US 231 and SR 26 (State) Loops are existing for all approaches and all lanes, just behind the stop bars (except the fifth) Existing Traffic Signal Infrastructure 9
US 231 and Tapawingo/Williams Loops existing for all NB lanes, except the RT lane, just prior to the stop bar Loops existing for all SB lanes, just prior to the stop bar Loops for both EB lanes No evident loops for WB lanes, but may have been buried within pavement Problem: Sharp incline on Williams Existing Traffic Signal Infrastructure 10
Outline • Corridor Overview • Identifying and Installing New Equipment (Joey) • Management of Data Collection • Performance Measure Reports • Report Interpretation • Schedule • Cost • Risk • Conclusions 11
Data Infrastructure Central Office Intersection 1 Database Reports ASC/3 VPN Intersection 2 Internet LAN ASC/3 VPN VPN Local FTP storage Fiber Intersection 3 ASC/3 12
Data Infrastructure Fiber ASC/3 Cat5 Cable 13
Data Infrastructure Detector Rack with Presence and Count Channels Side by Side (SR 37 & Pleasant, Noblesville, IN 14
Update controller to ASC3 Add additional detector cards for counting capabilities Add ethernet communication to all cabinets Install advance detectors in intersections Identifying New Field Equipment 15
Road closure will be coordinated with local officials The following INDOT documents will be used for guidelines: E805-SGDH-01 E805-SGDH-02 E805-SGDH-03 E805-SGLI-01 E805-SGLI-02 E805-SGLI-03 E805-SGLI-04 E805-SGLI-05 E805-SGLT-01 Advanced loops will be installed for the coordinated arterial Internet connectivity will be made available through a secure VPN Field Installation Process 16
2 Week Long Lead/Lag study Error Percentage for each day and each Lane will be characterized by Max Min Mean Velocity Estimation study 2 Week long reasonability study 100 vehicle ground truth study Error Reported Max Min Mean Standard Deviation Data Collection Management 17
Outline • Corridor Overview • Identifying and Installing New Equipment • Management of Data Collection • Performance Measure Reports (Chris) • Report Interpretation • Schedule • Cost • Risk • Conclusions 18
Proposed performance monitoring recommendations: Use ASC/3 controllers, which have data logging capability Install advance detectors on all northbound/southbound lanes, and potentially eastbound/westbound at State St. if east-west coordination is a concern Install stop bar detectors on all protected crossing movements that have their own phase Contractor will process collected data offline and return reports to the managing authority for decisions on maintenance Performance Measures 19
Performance Measures Vehicle Counts: Measure traffic volumes Volume-to-Capacity Ratio: Determine utilization of provided green time and identify when split failures take place Arrival Type: Determine quality of progression along the coordinated arterial (SR 43 and potentially SR 26) Intersection Saturation: Identify where timing plans can be improved by split adjustment or when more drastic action is needed Performance Measures 20
Monitored system at SR 37, Noblesville, IN Example Installation SR 37 & SR 32 SR 37 & Pleasant St. 21
Eight-phase 24-hour plots of performance measures for intersection of SR 37 and 32 in Noblesville, IN Example of Performance Measures 22
Vehicle Counts P1 SL P2 N P3 WL P4 E Counts P6 S P5 NL P7 EL P8 W 60 60 30 30 0 0 12:00 12:00 12:00 12:00 24:00 24:00 24:00 24:00 0:00 0:00 0:00 0:00 Time of Day 23
Equivalent Hourly Flow Rate P1 SL P2 N P3 WL P4 E Volume (veh/h/ln) P6 S P5 NL P7 EL P8 W 1500 1500 750 750 0 0 12:00 12:00 12:00 12:00 24:00 24:00 24:00 24:00 0:00 0:00 0:00 0:00 Time of Day 24
Green Time P1 SL P2 N P3 WL P4 E Green Time (veh/h/ln) P6 S P5 NL P7 EL P8 W 90 90 45 45 0 0 12:00 12:00 12:00 12:00 24:00 24:00 24:00 24:00 0:00 0:00 0:00 0:00 Time of Day 25
Volume-to-Capacity Ratio P1 SL P2 N P3 WL P4 E Volume (veh/h/ln) P6 S P5 NL P7 EL P8 W 1 1 0.5 0.5 0 0 12:00 12:00 12:00 12:00 24:00 24:00 24:00 24:00 0:00 0:00 0:00 0:00 Time of Day 26
Determined by value Volume-to-Capacity Ratio Higher v/c ratio more likely to be split failure Choose cutoff value of 1.0 Definition of split failure: Split Failures Short queue that will be served by the available green time for this phase Split failure: Not enough green time to clear all vehicles waiting in queue V/C = 0.55 V/C = 1.25 27
Number of Split Failures P1 SL P2 N P3 WL P4 E P6 S P5 NL P7 EL P8 W 6 6 Number of Split Failures per 30 mins 3 3 0 0 12:00 12:00 12:00 12:00 24:00 24:00 24:00 24:00 0:00 0:00 0:00 0:00 Time of Day 28
The degree to which the capacity of the entire intersection is being utilized. Intersection Saturation March 13, 2008 29
Intersection Saturation Simplifed equation for Dual-Ring, Eight-Phase Intersection: v1+v2 v7+v8 v5+v6 v3+v4 30
24-Hour Plot of Intersection SaturationShowing Critical Path Not so much Plenty of extra capacity March 13, 2008 31
XC in combination with # of split failures Suppose we have a problem with split failures during the PM peak hour (1500—1900) that we would like to address by split adjustments 1500--1900 time period Conclusion:Seems like split adjustments might help most phases… Phase 2 is probably doing about as good as it can without taking needed green time from elsewhere XC > 0.85, split failures unlikely to be remedied by split adjustments XC < 0.85, split failures more likely to be remedied by split adjustments 32
Arrival Type Southbound Phase 6 Northbound Phase 2 34
Visualization of Vehicle Arrivals Time in cycle 120 Cycle boundary Green phase ends Green phase begins Cycle begins Cycle ends 90 Red Green window 70 time 50 Green 0 sec 12:00:00 50 sec 90 sec 120 sec 12:02:00 70 sec 12:01:10 0 time of day 12:01:10 12:00:00 12:02:00 35
Visualization of Vehicle Arrivals Phase 2, 32 & 37 36
Visualization of Vehicle Arrivals Phase 6, 32 & 37 37
Aggregation Phase 6, 32 & 37 1500—1900 PM peak hour 38
Aggregation End of green Green window distribution Start of green Vehicle arrival distribution 39
Aggregation Phase 6, PM Peak 40
Aggregation Phase 2, PM Peak 41
Interpretation Good progression,AT = 5 or 6 Random arrivals,AT = 3 or 4 Poor progression,AT = 1 or 2 42
In addition to 24 hour plots, summary statistics will be provided in graphical format and printouts Following slides show examples Reporting 43
Example Graphical Summary Report SR 37, 0600-0900 NB & SB Avg. Arrival Type SR 37, 0600-0900 No. of Split Failures by Phase(3 of 6 intersections shown) 2.1 4.1 3.7 3.2 4.4 5.5 4.8 4.9 3.2 4.2 3.6 5.2 22 4 14 1 4 1 11 9 1 2 2 0 0 3 0 8 0 0 3 5 0 0 9/1/2014 44
Example Printout SR 43 CORRIDOR DATA PAGE 3 OF 27 02/14/2009 INTERSECTION ID #1 NAME: SR 43 AND TAPAWINGO AVERAGE VOLUME PER CYCLE (VEH/H) PHASE TOD PATTERN 1 2 3 4 5 6 7 8 0000 0 57 230 37 120 47 160 22 98 0600 1 31 305 214 305 92 1252 31 183 1000 2 62 652 124 403 341 714 31 372 1600 3 31 1394 186 434 186 651 31 419 2000 0 33 414 72 212 98 340 12 105 NUMBER OF SPLIT FAILURES (CUTOFF VALUE V/C = 1.00) PHASE TOD PATTERN 1 2 3 4 5 6 7 8 0000 0 0 0 0 0 1 0 0 0 0600 1 0 0 3 1 2 1 0 0 1000 2 0 0 1 2 11 0 0 0 1600 3 0 4 1 3 5 0 0 3 2000 0 0 0 0 0 1 0 0 0 etc... 9/1/2014 45
Finding Problems: Identifying the Ten Worst Arrival Types in Corridor Int. #1Phase 2 (Northbound)17:00 Friday 9/1/2014 46
Report will suggest times of day when splits adjustments might improve quality of service Interpretation of Performance Measures: Making Recommendations on Timing Plan Changes Report on Timing Plan Quality of Service Problems TOD Phase SF Fix/Nofix 6:00 1 0/0 6:00 2 0/0 6:00 3 3/1 6:00 4 4/2 6:00 5 11/4 6:00 6 0/1 6:00 7 3/2 6:00 8 0/0 9:00 1 0/0 9:00 2 0/0 9:00 3 2/1 9:00 4 3/2 … … … 47
Outline • Corridor Overview • Identifying and Installing New Equipment • Management of Data Collection • Performance Measure Reports • Report Interpretation • Schedule (Ron) • Cost • Risk • Conclusions 48
Project timeline from November 2008 to March 2010 Data collection from March 2009 to February 2010 Mid-study meeting early June 2009 Should any changes be made to the study process? Schedule 49
Capital Cost Loop upgrades: $425/loop for 24 loops Cabinet Upgrades: $2500/cabinet for 6 cabinets Data collection/processing server: $800 Internet installation: $1500 Operating Cost Internet connectivity: $150/month for 12 months Labor Cost Engineering design: $150/hr for 600 hours Labor Cost for Data Reduction/ Processing/Reporting Engineering hours: $150/hr for 900 hours Technician hours: $45/hr for 400 hours Project Cost : $272,300 Costs 50