Download
1 / 20
200 likes | 371 Vues
Signalized Intersection Delay Monitoring for Signal Retiming. SafeTrip-21 Safe and Efficient Travel through Innovation and Partnership in the 21 st Century. Sudhir Murthy, PE, PTOE President TrafInfo Communications, Inc. Lexington, MA. Presentation Outline. System Objectives

E N D
Signalized IntersectionDelay Monitoring forSignal Retiming SafeTrip-21 Safe and Efficient Travel through Innovation and Partnership in the 21st Century Sudhir Murthy, PE, PTOE President TrafInfo Communications, Inc. Lexington, MA
Presentation Outline • System Objectives • Methodology • Technology • Test Site • Equipment Installation • Data Collected • Results • Concluding Remarks
System Objectives • To monitor traffic operations at a signalized intersection in real-time (cycle-by-cycle) by: • Collecting traffic signal timing and volume data • Estimating control delay using procedure within the 2000 Highway Capacity Manual (HCM) • To develop a cost-effective system to • Identify signalized intersections in need of improvements (ex. Re-timing) • Allow remote download of new signal timing • Assess the benefits resulting from it
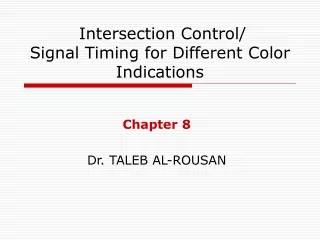
Methodology where HCM Control Delay d1 = uniform delayd2 = incremental delay d3 = initial queue delay g = effective green (sec) C = cycle length (sec) v = volume S = saturation flow rate PF = Progression Adjustment Factor (Exhibit 16-12 using Arrival Type) Directly measured Estimated from Directly measured Headway & Occupancy k = Incremental delay factor (Exhibit 16-13) I = Upstream filtering factor (assumed = 1.0) HCM Procedure
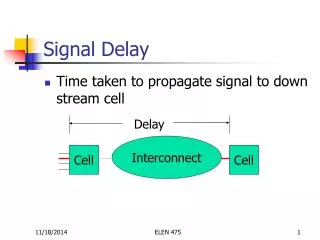
Technology GTT Canoga ™ Loop Detector • Traditional loop detector with count capability (including“long loop”) and a front panel serial port Trafmate™ 6 Integrated C-programmable micro-controller with dual serial port and wireless PCS cellular modem
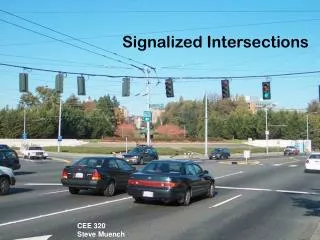
Test Site El Camino Real at Dumbarton Rd/Oakland St Redwood City, CA Φ4 N Φ2 Φ1 Φ5 Φ6 Φ4
Test Site Assessment • Calibration of Canoga loop detector parameters for “long-loop” counting Thorough assessment of each loop in terms of inductance waveforms
Long Loop Detection Technology Car 1 Car 2
Test Site Installation Signal Timing Traffic Volume AFTER BEFORE
Data Collected MySQL® Database Central Server Software Wireless Internet Web-Interface Control Delay User • Signal Timing • Total cycle length • Green time of each phase • Traffic Volume • Time to service first vehicle in queue • Volume during green & clearance • Total occupancy during green • Average headway (from 3rd to 10th vehicle)
Results - Control Delay Southbound Through Lane 1 Northbound Exclusive Left Lane
Unique Aspects of System Estimation of Saturation Flow Rate of each cycle from headway measurements Estimation of Arrival Type using occupancy and volume measurements
Direct Field Measurement of SFR 11 10 9 8 7 6 5 4 3 2 1 12 11 10 9 8 7 6 5 4 3 2 1 12 11 10 9 8 7 6 5 4 3 Headway measurements
Project Results – Saturation Flow Rate Default: Values computed using HCM Default: Values computed using HCM Estimated based upon headway – SB Thru Lane 1
Occupancy-Arrival Type Relationship 100% Actual Field Measurement Estimated Occupancy 0% 1 2 3 4 5 6 Arrival Type
Project Results - Arrival Type Estimated based upon occupancy and volume – SB Thru Lane 1
Steps to Retime Signals Collect data for 2-3 days and evaluate data to determine need for signal timing Use volume information to determine optimal signal timing (ex. Synchro, etc) Upload new signal timing to controller via the wireless modem Continue to collect data for another 2-3 days and evaluate data. Repeat steps if necessary or document improvements.
Concluding Remarks • Demonstrates a cost-effective method for signalized intersection traffic monitoring • Next Steps: • Additional reporting capability (ex. Peak hour) • Real-time adjustments to saturation flow rate and arrival types • Future Challenges: • Variety of detection systems for signal control • Data accuracy of detection systems