Download
1 / 20
200 likes | 313 Vues
Trend for Precision Soil Testing % Zone or Grid Samples Tested compared to Total Samples. AGVISE Laboratories % Zone or Grid Samples Tested Compared to Conventional Whole Field Composite Samples in 2013. AGVISE Laboratories %Zone or Grid Samples – Northwood laboratory 1997 - 2013.

E N D
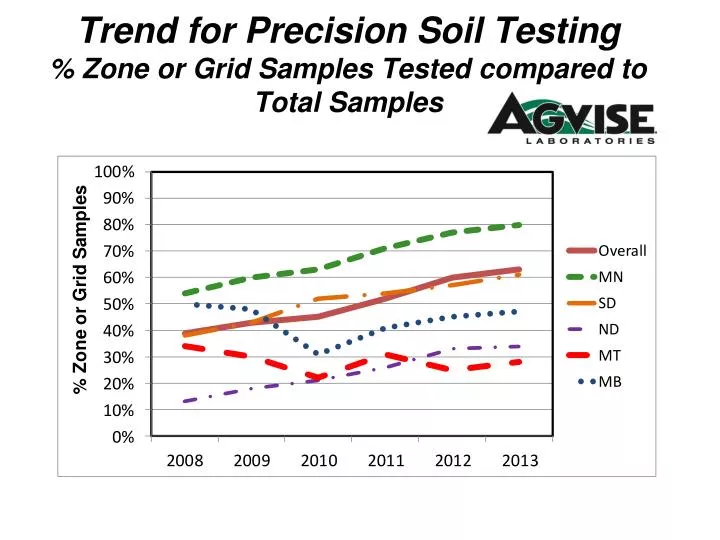
Trend for Precision Soil Testing% Zone or Grid Samples Tested compared to Total Samples
AGVISE Laboratories%Zone or Grid Samples Tested Compared to Conventional Whole Field Composite Samples in 2013
AGVISE Laboratories%Zone or Grid Samples – Northwood laboratory1997 - 2013 % Grid or Zone Samples Tested Compared To Conventional Whole Field Composite Samples Tested
Average Soil Nitrate following Wheat in 2013 Fall 2013 samples (lb/a 0-24” samples) 34 27 38 49 54
Soil Nitrate Variability Between Fields Following “WHEAT” in Montana - 2013
Average Soil Nitrate following Wheat in 2013 MB Fall 2013 Samples 31 (lb/a 0-24” samples) 47 40 52 24 42 38 54 23 32 28 35 30 ND 40 30 33 29 35 40 37 MN 39 44 SD 51 61
Soil Nitrate Variability Between Fields Following “Fallow” in Montana - 2013
% Soil Samples with Phosphorus less than 10 ppm Fall 2013 samples (0-6”) (Olsen P test) 45% 67% 36% 53% 52% 26%
% Soil Samples with Potassium less than 150 ppm Fall 2013 samples (0-6”) 15% 12% 1% 15% 10% 7%
% Soil Samples with Zinc less than 1.0 ppm Fall 2013 samples (0-6”) 92% 81% 81% 47% 63% 53%
% Soil Samples with Sulfur less than 15 lb/a Fall 2013 samples (0-6”) 61% 54% 46% 20% 12% 35%
% Soil Samples with Copper less than 0.5 ppm Fall 2013 samples (0-6”) 1% 6% 2% 5% 3% 1%
% Soil Samples with Boron less than 0.4 ppm Fall 2013 samples (0-6”) 18% 11% 10% 5% 1% 3%
% Soil Samples with Chloride less than 40 lb/a Fall 2013 samples (0-6”) 82% 66% 71% 48% 42% 58%
% Soil Samples with Carbonate greater than 5.0% Fall 2013 samples (0-6”) 3% 24% 17% 14% 5% 46%
% Soil Samples with Salts greater than 1.0 mmhos/cm Fall 2013 samples (0-6”) 2% 2% 3% 5% 8% 3%
% Soil Samples with soil pH greater than 7.3 Fall 2013 samples (0-6”) 66% 76% 72% 88% 92% 79%
% Soil Samples with soil pH less than 6.0 Fall 2013 samples (0-6”) 4% 4% 3% 2% 1% 2%
% Soil Samples with %OM less than 3.0% Fall 2013 samples (0-6”) 96% 84% 71% 83% 88% 47%
Zip codes for Montana 599 595 592 594 598 596 593 590-591 597