Download
1 / 1
10 likes | 147 Vues
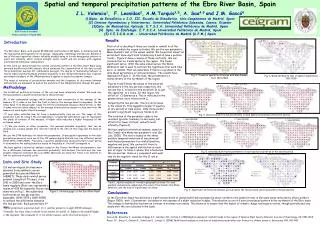
Spatial and temporal precipitation patterns of the Ebro River Basin, Spain J.L . Valencia 1 , F. Leonidas 2 , A.M.Tarquis 3,5 , A. Saa 4,5 and J.M. Gascó 4. Dpto . de Estadística e I.O. III. Escuela de Estadística . Univ.Complutense de Madrid, Spain

E N D
Spatial and temporal precipitation patterns of the Ebro River Basin, Spain J.L. Valencia1, F. Leonidas2, A.M.Tarquis3,5, A. Saa4,5 and J.M. Gascó4 • Dpto. de Estadística e I.O. III. Escuela de Estadística. Univ.Complutense de Madrid, Spain • Ciencias Agronómicas y Veterinarias. Universidad Politécnica Salesiana, Cuenca, Ecuador • Dpto. de MatemáticaAplicada. E.T.S.I.A. Universidad Politécnica de Madrid, Spain • Dpto. de Edafología. E.T.S.I.A. Universidad Politécnica de Madrid, Spain • C.E.I.G.R.A.M. - Universidad Politécnica de Madrid (U.P.M.) Spain EGU General Assembly Vienna, Austria 3–8 April 2011 Introduction The Ebro River Basin, with around 85 000 km2 and located in NE Spain, is characterized by the high spatial heterogeneity of its geology, topography, climatology and land use. Rainfall is one of the most important climatic variables studied owing to its non-homogenous behavior in event and intensity, which creates drought, water runoff and soil erosion with negative environmental and social consequences. In this work we characterized the rainfall variability pattern in the Ebro River Basin using universal multifractal (UM) analysis, which estimates the concentration of the data around the precipitation average (C1, codimension average), the degree of multiscaling behavior in time (α index) and the maximum probable singularity in the rainfall distribution (γs). A spatial and temporal analysis of the UM parameters is applied to study the possible changes. The range of variation of precipitation amounts and the frequency of dry events between both periods are discussed, as well as the evolution of the UM parameters through the years. Results First of allis checking if there are trends in rainfall in all the squares in which the region is divided. We use the non-parametric Mann-Kendall’s test at the annual rainfall. We found that almost all series don’t show significant trends (only 4 and all have a positive trend) . Figure 2 show a resume of these contrasts. We can conclude that no trends spatial in the region. The found significant series With the same annual series, the Wald-Wolfowitz test is used to contrast the hypothesis that each time serie is random. That can determine if there is a problem in the data about persistence or anti-persistence. The results have displayed in Figure 3. In this case, the persistence is a characteristic of the northwest of the region. Fig. 2. Trends at spatiallocalitationswithMan-Kendall Test. 1931-2009 Fig. 3. Wald_Wolfowitz test at spatiallocalitations 1931-2009 Figures 4 and 5 show thevalues of the universal parameters in thetwoperiodsrespectivly. We can seelike C1islowest in thenorwesth. Itisjusttheopposittetoαindex. In thisregion, the effect of C1 dominates α. This is reflected in the gamma values, more related with C1. Comparing the two periods, there is an increase in the values C1. This suggests a higher frequency of dry periods at time scales. Only threw points present a significant negatives trends in C1. The evolution of the parameter alpha is the reversed (greater tendency to decrease), but affects far fewer stations and with least intensity (Figure 6). We have applied a statistical analysis, based on the Cramér-Von Mises non-parametric test (De Luis, 2000) . The test is based on the three possible temporal evolutions of any universal multifractal parameters for rainfall (positive, negative and zero). We contrast if there is differences in the spatial distribution of each pair of signs. Te table 1 resume this information. We can see like there is a component east-west only by the negative trend for the C1 and αparameters • Methodology • The statistical multifractal nature of the rain has been intensively studied. We need only three parameters a multifractal function is characterized. • C1is the codimensionaverage, which estimates how concentrate is the average of the measure. If C1 value is low then the field is close to the average almost everywhere. On the other hand, if C1 shows higher values tan 0.5 the predominant measure characteristic is that it takes very low values respect to the average in many places except in a few ones that the measure is much higher than the average. • Levy indexindicates how far from a monofractality case we are. The range of this parameter is [0, 2], being 2 the corresponding to a lognormal distribution case. It represents the grade of variance of the measure. A higher value indicates a higher frequency of the extremes values. • We can obtain an other parameter, the maximal probable singularity that can be observed on a unique sample. It’s directly related to the ratio of the range and the mean of field. • We use the DTM technique for obtain the parameters. It was applied separately on the daily precipitation series at each one of the 132 meteorological stations over two different period (1931-1975 y 1965-2009). Previously, a spectral analysis have been performed in each period to determinate the scaling behaviour based on frequency w , that will correspond to . • Wehaveapplied a statisticalanalysis, basedontheCramer-Von Mises non-parametric test fora difference between two univariate probability distributions functions and the tree possible temporal evolutions (De Luis 2000). Moreover we study the trend in all stations to look for patterns at spatial cords. Fig. 4. Universal multifractalsparemeters in eachspatiallocalitation at thefirstperiod. Fig. 5. Universal multifractalparemeters in eachspatiallocalitation at thesecondperiod. Data and Site Study 132 meteorological stations were selected from synthetic series generated by Luna and Balairón (AEMET). These daily rainfall series present a length of 79 years, from 1931 to 2009 and cover the Ebro basin regularly (Each one represents a region of 625 Km squarely) like we can observed en Fig.1 . We subdivided each series en two periods non separable: (1931-1975 y 1965-2009) to analyze the difference between the two periods . Each period have 214 days. Table 1. Spatialanalysis of trends in geographicalmode. Foreachgradient and pairwisecomparison, thevalue of theCramér-Von Mises sstatistic and thelevel of significance are show Fig. 6. Significant differences between periods about the two principal Universal multifractal parameters Figure 1 stations gauge at the Ebro River Basin Conclusions: In the Ebro River Basin has detected a significantevolutionof global multifractal parameters about rainfall to the general trend, in the same sense detected by others authors (Roger 2008) , with C1 parameter increased at the expense of a slight reduction in alpha. This situation occurs in a more pronounced pattern in the northwest of the Ebro basin. This change in distribution has been an increase in extreme rain events. This allows us to ensure that the impact of climate change has begun to notice, though partially and very slowly with the rain collected in the basin. References De Luis M., Raventos J., Gonzalez-Hidalgo J.C., Sanchez J.R., Cortina J. (2000)Spatial analysis of rainfall trends in the region of Valencia (East Spain). Internat. Journal of Climatology, 20: 1451-1469. Royer J.F, Biaou A., Chauvin F., Schertzer D., Lovejoi S. (2008). Multifractal analysis of evolution of simulated precipitation over France in a climate scenario. Geoscience 340, 431-440.