Download
1 / 30
300 likes | 401 Vues
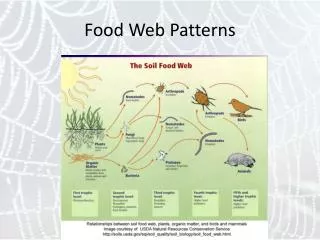
Spatial and temporal patterns in food web accumulation of Hg. Project Update RMP Technical Review Committee March 18, 2008. Workplan: Specific questions to address. Where is mercury entering the Bay food web?

E N D
Spatial and temporal patterns in food web accumulation of Hg Project Update RMP Technical Review Committee March 18, 2008
Workplan: Specific questions to address • Where is mercury entering the Bay food web? • What habitats, conditions, or factors help to identify hotspots of food web accumulation in Bay margins? • Are there interannual trends in MeHg bioaccumulation resulting from wetland and margin restoration activities? • What are the best biomonitoring tools for characterizing hotspots of MeHg bioaccumulation?
General approach • Spatial analysis • Stratified random design • Identify hotspots based on conceptual model • Seasonal trend evaluation • Interannual trend detection • Field sampling for Hg isotopes and for DGT study
Allocation of effort • Total of 70 sampling events per year to evaluate spatial, seasonal, and interannual patterns
Spatial survey • Test hypotheses of MeHg entry points and food web accumulation hotspots • Hg source sites • Wetlands and wetland type • Enclosed subembayments and estuarine creeks • Sediment parameters
Spatial survey sites chosen probabilistically Same GRTS method as Status and Trends Program More powerful inference than with sites of convenience What types of conditions Bay-wide higher Hg Identify spatial gradients (e.g., South/North?) Even if all our hypotheses are wrong, we are still characterizing conditions and identifying hotspots Bay-wide
So What Are the Areas Sampled? Entire shoreline of Bay Lower South Bay to Suisun Bay Estuarine tributaries All subtidal wetlands Not sampling Offshore locations Salt ponds (weak connection to Bay) Marine lakes (e.g., Aquatic Park, Anza Lagoon) Islands within Bay (e.g., Angel Island, Red Rock)
Preliminary map of areas to be sampled • GIS based on morphology, size, depth • Strata 1: • Open Shorelines • -Strata 2: • Submbayments
Source site selection • Mining sources • Creeks draining La Joya, Bella Oaks, Borges, and New Almaden Mines • POTW discharges • 11 shallow-water wastewater treatment plants recommended by RB NPDES Permitting Staff • Creeks draining urban/industrial areas • Identified for part of Bay by Prop 13 Stormwater BMP project • Based on historic industrial area and railway lines, auto recycling facilities, and Hg hotspots • Industrial areas with high sediment THg • BPTCP sites having sediment THg > 0.7 ppm • Total of about 50 sites
Wetland site selection • Oversight by Josh Collins and Letitia Grenier • Based on GRTS sampling performed for SBMP and CRAM • Stratified based on relative wetland elevation and age
Coordination and Collaboration • University of Michigan – RMP Hg stable isotope study (Joel Blum, Gretchen Gehrke) • Hg isotope sites characterize specific sources • Urban runoff, mining, waste water, atmospheric deposition • Sites will be chosen from small fish source sites after probabilistic site selection is complete • Augment with small number additional sites (e.g., Guadalupe Reservoir to represent mine signal) • Sediment Hg and isotope analysis
Coordination and Collaboration • Trent University – Diffusive Gradient in Thinfilm devices (Holger Hintelmann) • Just completing analyses of the pilot study data (2007) • Year 1 - validation • 15 small fish sites varying in chemistry and expected bioaccumulation • Likely overlap with mercury isotope sites • Year 2 – process studies • Source sites of interest including fishless locations • Likely include SPL sites (e.g., Z4LA) • Report available February 2010 • Addition of water column DOC as correlate
Discussion points • Other suggested source sites? • Agree with area and types of sites covered? • Entire shoreline of Bay • Lower South Bay to Suisun Bay • Estuarine tributaries • All subtidal wetlands • Not salt ponds, marine lakes, offshore, or small islands • Phased plan for DGT study
END OF TALK • REST IS ANCILLARY MATERIAL IN EVENT OF DISCUSSION
Sediment MeHg may be correlated with topsmelt Hg • Topsmelt 2006 data • RMP and Calfed • sediment data within 1.5 km disk of fish • R2 = 0.61
Trend Sampling Locations Hamilton Benicia Park China Camp Control Point Isabel Impact (Restoration) Oakland Middle Harbor Candlestick Point Eden Landing Bird Island/ Steinberger Slough Newark Slough Alviso Slough
Trend Sampling Locations Hamilton Benicia Park China Camp Control Point Isabel Impact (Restoration) Oakland Middle Harbor Candlestick Point Eden Landing Bird Island/ Steinberger Slough Newark Slough Alviso Slough
Monthly sampling locations Additional North Bay Station Sampled by USFWS Martin Luther King Shoreline
Collection of additional parameters • Aimed at better understanding mechanisms for spatial variation in bioavailable Hg • GIS spatial parameters • Sediment parameters
Sediment parameters Sediment parameters: redox, TON, grain size, total and methyl Hg Samples at subset of 20 Sites
Sediment MeHg: < 1 ng/g 1 – 2 ng/g > 2 ng/g