Download
1 / 36
3.28k likes | 9.89k Vues
Introduction to Raman Spectroscopy. Ze’ev Abrams (who freely plagiarized from: Hezy Amiel & Xin Heng ) Tel-Aviv University December 2004. Outline. Introduction Theory of atomic vibrations and Raman scattering Instrumentation for Raman spectroscopy

E N D
Introduction toRaman Spectroscopy Ze’ev Abrams (who freely plagiarized from: Hezy Amiel & Xin Heng ) Tel-Aviv University December 2004
Outline • Introduction • Theory of atomic vibrations and Raman scattering • Instrumentation for Raman spectroscopy • Raman Spectroscopy for Carbon Nanotubes • Examples
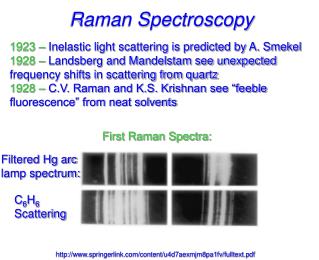
Chandrasekhara Venkata Raman • 1888-1970 • Discovered the inelastic scattering phenomenon in 1928 • Was awarded the Nobel Prize for Physics in 1930 a.k.a. Sir Chandra
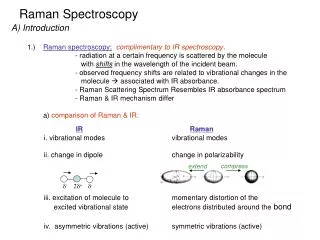
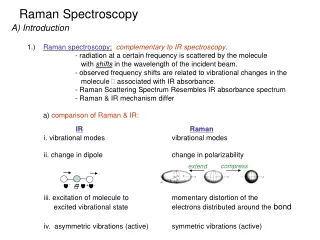
Raman spectroscopy probes the vibration modes of materials, much like infrared (IR) spectroscopy. • However, whereas IR bands arise from a change in the dipole moment, Raman bands arise from a change in the polarizability. • In many cases, transitions that are allowed in Raman are forbidden in IR, so these techniques are often complementary.
Applications of Raman Spectroscopy Raman Spectroscopy is a method of determining modes of molecular motions, especially vibrations. It is predominantly applicable to the qualitative and quantitative analyses of covalently bonded molecules. Extra: -Identification of phases (mineral inclusions, composition of the gas phase inclusions) -Anions in the fluid phase (OH-, HS-, etc.) -Identification of crystalline polymorphs (Sillimanite, Kyanite, andalusite, etc.) -Measurement of mid-range order of solids -Measurement of stress -High-pressure and High-temperature in situ studies -Phase transition and order-disorder transitions in minerals (quartz, graphite) -Water content of silicate glasses and minerals -Speciation of water in glasses To visit caltech webpage: mineral.gps.caltech.edu Mineral Spectroscopy Server.
Energy Scheme for Photon Scattering Virtual State hn0+hnm hn0 Energy hn0 hn0 hn0 hn0-hnm E0+hnm E0 Rayleigh Scattering (elastic) Stokes Scattering Anti-Stokes Scattering IR Absorption E-hvm Raman (inelastic) The Raman effect comprises a very small fraction, about 1 in 107 of the incident photons.
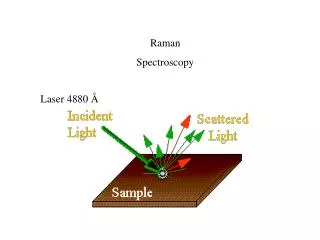
IR Spectrography - Absorption I0(n) I(n) Laser Sample detector Raman Spectrography - Scattering Sample n0 nM- Raman n0 n0- Rayleigh detector Laser
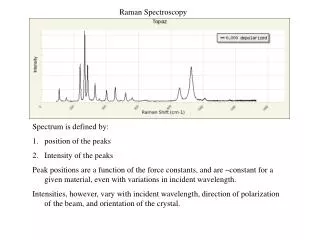
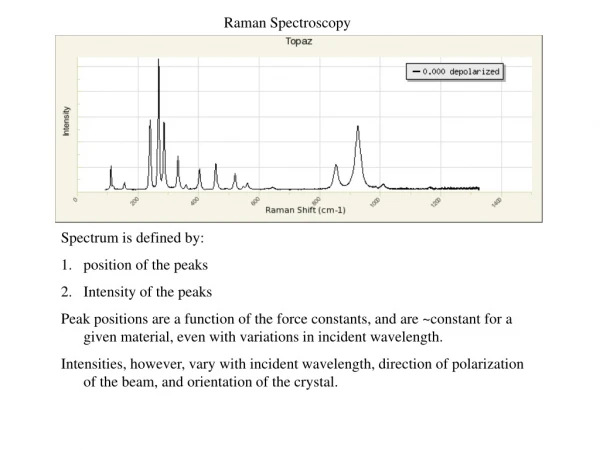
Raman Spectrum A Raman spectrum is a plot of the intensity of Raman scattered radiation as a function of its frequency difference from the incident radiation (usually in units of wavenumbers, cm-1). This difference is called the Raman shift. Raman Spectrum of CCl4
Outline • Introduction • Theory of atomic vibrations and Raman scattering • Instrumentation for Raman spectroscopy • Raman Spectroscopy for Carbon Nanotubes • Examples
x1 K x2 m1 m2 The simplest real vibrating system:a diatomic molecule Just like Hooke’s law: F=kX displacement Reduced mass Where:
Scattering of radiation from a diatomic molecule ? Induced dipole moment: For a small amplitude of vibration, the polarizability a is a linear function of q: Rayleigh scattering Stokes scattering Anti-Stokes scattering
Example 1: the vibration modes of CO2 Raman Active IR Active IR Active
Example 2: the vibration modes of H2O All the modes are both Raman & IR Active
Normal vibrations of CH2Cl2 n = stretching d = bending
Selection rules y0 and y1 are the wavefunctions of a ‘molecule’ before and after a vibrational transition, respectively. mi ( i = x,y,z ) are the components of the dipole moment. If one of the integrals Ii 0, than the transition is IR active aij ( i,j = x,y,z ) are the components of the polarizability tensor. If one of the integrals Iij 0, than the transition is Raman active
The simplest Raman active crystal:1D chain with 2 atoms in the unit cell m1 m2 K u2n+1 u2n Equations of motion: Assume the solutions: Obtain the frequencies:
The ‘phonon’ spectrum IR & Raman Active
Outline • Introduction • Theory of atomic vibrations and Raman scattering • Instrumentation for Raman spectroscopy • Raman Spectroscopy for Carbon Nanotubes • Examples
Typical geometries for Raman scattring 90o scattering 180o scattering
Spectrographs for Raman Spex 1877 triple monochromator Spex 1403/4 double monochromator
Photo-Detectors Charge coupled device (CCD) Photodiode array detector
Outline • Introduction • Theory of atomic vibrations and Raman scattering • Instrumentation for Raman spectroscopy • Raman Spectroscopy for Carbon Nanotubes • Examples
The first major study of CNTs using Raman Spectroscopyin: SCIENCE VOL. 275 10 JANUARY 1997 (4 years after CNTs were discovered by Iijima)
From the aforementioned article: These were the original “modes” thought to have been in an SWNT. Note the UNIT CELL in the upper right.
Of course, I made life easier for you all by not giving you the “real” article which was 19 pages long
The connection between the tube diameter and the “breathing” frequency: And the main symmetry groups used:
One Example: Near-field Raman of SWNT(Hartschuh et al.High-Resolution Near-Field Raman Microscopy of Single-Walled Carbon Nanotubes , P.R.L.,9, 95503,(2003)) Technique:Tip-enhanced SERS (Silver tip is raster scanned over sample surface) Object: single-wall nanotube (SWNT) **The 1st paper to show SWNT was detected optically with <30 nm resolution in Raman Spectroscopy Experimental Setup: (1) Optical microscopywith x, y scan stage; (2) Laser beamis focused on sample surface, polarized along tip axis (3) Sharp Ag tip(10-15 nm in radius) positioned near the focus of laser beam and above sample about 1 nm (sensitive! ) (4) Raman scattering is collectedwith same objective, transmitted by beam-splitter and filtered by a long pass filter (5) Signals are detectedby either a combination of a spectrograph and a thermoelectrically cooled CCD or by a narrow band-pass filter (FWHM=10 nm) centered at 760 or 700 nm followed by a photon counting avalanche photo-diode Two different types of SWNTs (1) SWNT bundles grown by CVD on substrate (2) Purified SWNTs with diameter 1.0-1.8 nm produced by arc-discharge
Fig 2 Simultaneous near-field Raman image (a) and topographic image (b) of SWNT grown by CVD. The Raman image is acquired by detecting Intensity of the G’ band upon laser excitation at 633 nm. Cross sections are taken along the indicated dashed line in (c) Raman image and (d) topographic image. The height of individual tubes is about 1.4 nm. Vertical units are photon counts / second -Resolution of SERS-Raman is better than topographic image -No Raman scattering signal is detected from humidity related circular features present in the topographic image. -Vertically and horizontally oriented SWNTs are observed in Raman image with similar signal intensities even if laser is z-polarized (right above). (different from far field Raman, right)
Fig (3)(a) dependence of Raman scattering strength of G’ band on the longitudinal separation ( ) between a single SWNT and the tip. The solid line is an exponential fit with a decay length of 11nm. The signal is normalized with the far-field signal. (b) Scanning electron microscopy of a sharp Ag tip fabricated by focused ion beam milling. -Fig. (3) demonstrates enhanced field confinement in longitudinal direction. --Tip is positioned above one SWNT and Raman scattering strength is recorded as function of . The curve is fitted with exponential and normalized with Raman strength without Ag tip. 11nm fit is consistent with 10-15nm tip radius. --High experimental enhancement is 1000, compared with theoretical) Fig (4) (a) Three-dimensional topographic image of a SWNT grown by Arc-discharge. The 3 bumps with height 5 nm are presumably enclosed Ni/Y catalyst particles and indicate the initial point of growth. (b) Near field Raman spectra detected at the marked positions 1 to 4 in (a). The spectra is offset for clarity. 1) G band at 1596 nm^(-1) is not shifted V.S.G’ band at 2619 is shifted to 2610 and double peaked 2) Explanation: Variations in Raman spectrum reflect changes in the molecular structure caused by external stress, catalyst particles, or local defect, etc.