Download
1 / 81
1.7k likes | 2.78k Vues
Introduction to Basics of Raman Spectroscopy. Chandrabhas Narayana Chemistry and Physics of Materials Jawaharlal Nehru Centre for Advanced Scientific Research, Jakkur P.O., Bangalore 560064, India cbhas@jncasr.ac.in http://www.jncasr.ac.in/cbhas.

E N D
Introduction to Basics of Raman Spectroscopy ChandrabhasNarayana Chemistry and Physics of Materials Jawaharlal Nehru Centre for Advanced Scientific Research, Jakkur P.O., Bangalore 560064, India cbhas@jncasr.ac.in http://www.jncasr.ac.in/cbhas Lecture at MASTANI Summer School, IISER, Pune, June 30, 2014 to July 12, 2014 July 11, 2014
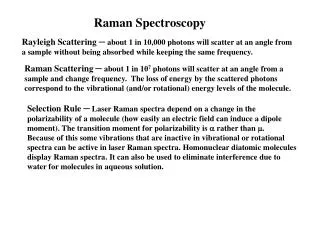
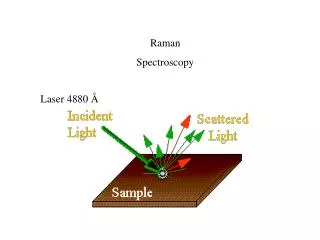
What happens when light falls on a material? Transmission Reflection Absorption Luminescence Elastic Scattering Inelastic Scattering
virtual state Scattered Excitation v” = 1 v” = 0 Infrared (absorption) Raman (scattering) Raman Spectroscopy 1 in 107 photons is scattered inelastically Rotational Raman Vibrational Raman Electronic Raman
Raman, Fluorescence and IR Absorption and emission Scattering Absorption
Concept of normal modes in a molecule • There are 3N possible movements in a molecule made of N atoms, each of which moving in one of three directions, x, y and z. • There are three transitional movements: all atoms in the molecule moving in x, y or z direction at the same time. • There are three rotational movements around x, y or z-axis • Linear molecules are exceptions because two axes that are perpendicular to the molecular axis are identical. • The rest of movements are vibrational movements • For linear molecules, 3N – 5 movements • For non-linear molecules, 3N – 6 movements • All vibrational movements of the sample can be described as linear combinations of vibrational normal modes.
Vibrations in Molecules Sym. Stretching 8086 cm-1 = 1 eV HCl n = 2991 cm-1 HF n = 4139 cm-1 Sym. Bending Asym. Stretching H2O n1 = 3835 cm-1 n3 = 3939 cm-1 n2 = 1648 cm-1 Asym. Bending NH3 n1 = 3505.7 cm-1 n4 = 1689.7 cm-1 n3 = 3573.1 cm-1 n2 = 1022 cm-1 SF6 n5 = 643.35 cm-1 n2 = 615.02 cm-1 n6 = 348.08 cm-1 n3 = 947.98 cm-1 n4 = 523.56 cm-1 n1 = 774.55 cm-1
Vibrational Spectroscopy For a diatomic molecule (A-B), the bond between the two atoms can be approximated by a spring that restores the distance between A and B to its equilibrium value. The bond can be assigned a force constant, k (in Nm-1; the stronger the bond, the larger k) and the relationship between the frequency of the vibration, , is given by the relationship: DAB or, more typically where , c is the speed of light, is the frequency in “wave numbers” (cm-1) and is the reduced mass (in amu) of A and B given by the equation: 0 rAB re re = equilibrium distance between A and B DAB = energy required to dissociate into A and B atoms
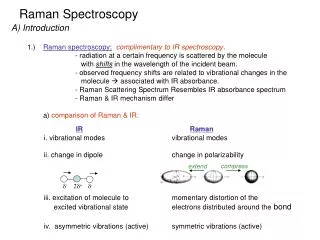
Vibrational Spectroscopy can be rearranged to solve for k (in N/m): For a vibration to be active (observable) in an infrared (IR) spectrum, the vibration must change the dipole moment of the molecule. (the vibrations for Cl2, Br2, and N2 will not be observed in an IR experiment) For a vibration to be active in a Raman spectrum, the vibration must change the polarizability of the molecule.
Classical Picture of Raman Induced Polarization Polarizability Stokes Raman Anti-Stokes Raman
Raman Scattering Selection rule: Dv = ±1 Overtones: Dv = ±2, ±3, … Must also have a change in polarizability Classical Description does not suggest any difference between Stokes and Anti-Stokes intensities www.andor.com
Are you getting the concept? Calculate the ratio of Anti-Stokes to Stokes scattering intensity when T = 300 K and the vibrational frequency is 1440 cm-1. h = 6.63 x 10⁻³⁴ Js k = 1.38 x 10⁻²³ J/K ~ 0.5
S <eg,p2|Her|p2,eb> <eb,p2|Hep|p1,ea> <ea,p1|Her|p1,eg> |Es-Eb|x|Ei-Ea| a,b Energy diagram and Quantum picture Virtual states Raman cross section photon ex g Electronic states Vibrational states If Ei = Ea or Es =Eb We have Resonance Raman effect
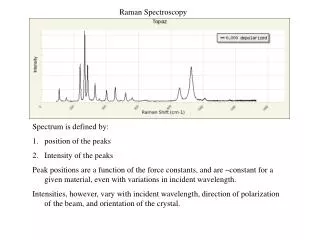
Intensity of Normal Raman Peaks The intensity or power of a normal Raman peak depends in a complex way upon • the polarizability of the molecule, • the intensity of the source, and • the concentration of the active group. • The power of Raman emission increases with the fourth power of the frequency of the source; - photodecomposition is a problem. • Raman intensities are usually directly proportional to the concentration of the active species.
Raman Depolarization Ratios Polarization is a property of a beam of radiation and describes the plane in which the radiation vibrates. Raman spectra are excited by plane-polarized radiation. The scattered radiation is found to be polarized to various degrees depending upon the type of vibration responsible for the scattering.
Raman Depolarization Ratios The depolarization ratio p is defined as Experimentally, the depolarization ratio may be obtained by inserting a polarizer between the sample and the monochromator. The depolarization ratio is dependent upon the symmetry of the vibrations responsible for scattering.
Raman Depolarization Ratios Polarized band: p = < 0.76 for totally symmetric modes (A1g) Depolarized band: p = 0.76 for B1g and B2g nonsymmetrical vibrational modes Anomalously polarized band: p = > 0.76 for A2g vibrational modes
Raman spectra of CCl4 Isotope effect Cl has two isotopes 35Cl and 37Cl Relative abundance is 3:1
CCl4 Spectra • 461.5 cm-1 is due to 35Cl4C • 458.4 cm-1 is due to 35Cl337ClC • 455.1 cm-1 is due to 35Cl237Cl2C • What are the two question marks? • Why are these bands weak?
CASR Raman Spectra of Methanol and Ethanol CH stretching CCO stretching CH3 and CH2 deformation Raman Intensity (arbitrary unit) OH stretching CO stretching CH3 deformation Raman Shift (cm-1) Significant identification of alcohols which differ just in one CH2-group
Raman Intensity (arbitrary unit) 500 1000 1500 2000 2500 3000 3500 Raman Shift (cm-1) CASR Peak position – Chemical identity – Similar Structures 3,4-Methylenedioxymethamphetamine (MDMA) Methamphetamine ecstasy
The Mass Effect on Raman Spectra CASR Significant identification of salts (SO42-) which differ just in the metal ion employed Mg - SO4 Na2 -SO4
CASR Peak positions – Chemical identity Diasteromers Ephedrine Pseudoephedrine Raman Intensity (arbitrary unit) 500 1000 1500 2000 2500 3000 3500 Raman Shift (cm-1)
Peak Position – Crystal Phases – Polymorphs Both Anatase and Rutile are TiO2 but of different polymorphic forms - identical chemical composition, different crystalline structures. Rutile Anatase
CASR Peak Shift – Stress and Strain Larnite (b – Ca2SiO4) inclusion in Diamond Nasdala, L., Harris, J.W. & Hofmeister, W. (2007): Micro-spectroscopy of diamond. Asia Oceania Geosciences Society, 4th Annual Meeting, Bangkok, Thailand, August, 2007. Nasdala, L., Raman barometry of mineral inclusions in diamond crystals. Mitt. Österr. Miner. Ges. 149 (2004)
CASR Bandwidth – Crystallinity – Structural order/disorder Raman spectra of zircon, showing typical amorphous (blue) and crystalline (red) spectra.
CASR Intensity – Concentration 4-Nitrophenol dissolved in CH2Cl2
CASR Raman technique – what requirements are needed? • Requirements for Raman technique to determine peak position, peak shift, bandwidth and intensity • Laser Excitation • Reduction of stray light • Collecting Optics • Spectral resolution and spectral coverage • Spatial resolution and confocality • Sensitivity: subject to detector • Light flux: subject to dispersion
What do we need to make a Raman measurement ? • Monochromatic Light source typically a laser • (A way of focusing the laser onto the sample and then collecting the Raman scatter.) • Sampling optics • Rejection filter • (A way of removing the scattered light that is not shifted( changed in colour). • Spectrometer and detector • (often a single grating spectrometer • and CCD detector.) CASR Detector Grating Filter Laser Sample
Demonstration of the very high spectral resolution obtained in the triple additive mode CASR Rotation-Vibration Spectrum of O2 Triple additive mode Slit widths= 30 mm Triple subtractive mode . Slit=30 mm
Laser wavelength, 3 Raman shift, 3-1+ Laser wavelength, 3 Fluorescence Laser wavelength, 1 Raman shift, 1-1+ Laser wavelength: 3 < 2 < 1 CASR Laser excitation – Laser Selection to avoid fluorescence
CASR Laser excitation – Laser selection to avoid fluorescence Green spectrum: 532 nm laser Red spectrum: 633 nm laser Dark red spectrum: 785 nm laser Fluorescence is wavelength dependent Ordinary Raman is wavelength independent
Laser excitation – Laser selection to avoid fluorescence CASR Commercial Hand Cream 785 nm – 633 nm – 473 nm • Reduction of Fluorescence
CASR Laser excitation – laser radiation power
CASR Laser excitation – laser radiation power • Keep in mind: the usage of high numerical objective lenses causes a very small spot size of the laser which results in a high power density • To avoid sample burning radiation power has to be adapted INDIVIDUALY to the sample
CASR Collecting Optics Collection solid angle Large for high N.A. lens Small for low N.A. lens Working distance High N.A. lens Low N.A. lens Sampling volume Small for high N.A. lens Large for low N.A. lens Working distance θ θ Laser spot size Small for high N.A. lens Large for low N.A. lens NA = n · sin (Q) n: refraction index Q: aperture angle
CASR Collecting Optics – Overview on common objectives
CASR Collecting Optics – what objective should be used? A distinction between opaque and transparent samples has to be made • For opaque samples, high N.A. lens works better because there is almost no penetration of the laser into the sample. High N.A. lens enables • High laser power density (mW/m3) increases sensitivity • Wide collection solid angle increases sensitivity 100 % Example for an opaque sample: Silicon wafer Silicon x100 – NA = 0.9 – 31.350 C/s x50 – NA = 0.75 - 21.995 C/s x10 – NA = 0.25 - 1.462 C/s 70 % 5 %
Sample: Cyclohexane Instrument: ARAMIS Red: x100LWD, 7,000 cts/s Blue: Macro lens, 14,500 cts/s 100 % 48 % CASR Collecting Optics – what objective should be used? A distinction between opaque and transparent samples has to be made • For transparent samples, low N.A. lens works better because of penetration of the laser into the sample. Low N.A. lens enables • Large sampling volume increases sensitivity
CASR Spectral resolution and spectral coverage Schematic diagram of a Czerny-Turner spectrograph Slit Collimating mirror Grating Focusing mirror Detector Focal Length
CASR Spectral resolution and spectral coverage • Spectral resolution is a function of 1. dispersion, 2. widths of entrance slit and 3. pixel size of the CCD • Dispersion is the relation between refraction of light according to the wavelength of light • Dispersion is a function of the 1. focal length of spectrograph the 2. groove density of the grating and 3. the excitation wavelength • In general, long focal length and high groove density grating offer high spectral resolution.
CASR Dispersion as a function of the focal length Short focal length CCD Detector Same grating Same excitation wavelength Long focal length CCD Detector
CASR Dispersion as a function of the focal length vis-a vis wavelength Dispersion in cm-1 / pixel 1800 gr/mm Grating LabRAM (F = 300 mm) LabRAM HR (F = 800 mm)
CASR Dispersion as a function of excitation wavelength Same focal length Same grating CCD Detector CCD Detector Short wavelength Long wavelength
473 nm –633 nm – 785 nm Same focal length Same grating Relative Raman shift of 3100 cm-1 corresponds to 81 nm Relative Raman shift of 3100 cm-1 corresponds to 154 nm Relative Raman shift of 3100 cm-1 corresponds to 252 nm CASR Spectral coverage - dependence from excitation wavelength Length of CCD Chip Length of CCD Chip Length of CCD Chip
CASR Dispersion as a function of groove density CCD Detector CCD Detector Low density groove grating High density groove grating Same focal length Same excitation wavelength
CASR Spectral resolution as a function slit width Slit Slit Slit One of parameters that determines the spectral resolution is the entrance slit width. The narrower the slit, the narrower the FWHM (full width at half maximum), and higher the spectral resolution. When recording a line whose natural width is smaller than the monochromator’s resolution, the measured width will reflect the spectrograph’s resolution.
CASR Spectral resolution as a function of pixel size • Because a CCD detector is made of very small pixels, each pixel serves as an exit slit (pixel size = exit slit width) • For the same size CCDs, the CCD with a larger number of smaller pixels produces a larger number of spectral points closer to each other increasing the limiting spectral resolution and the sampling frequency • 26 m pixel vs. 52 m pixel (simulation) Detector Detector