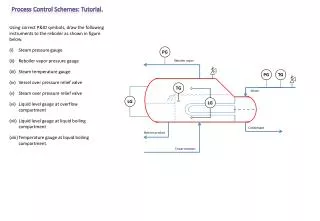
Download
1 / 7
350 likes | 1.94k Vues
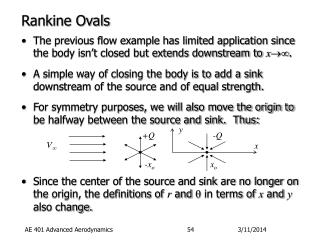
LAB 8: Steam Turbine (Rankine Cycle Experiment). ENTC - 370. Rankine Cycle. Process 1-2: Isentropic compression Process 2-3: Isobaric heat addition Process 3-4: Isentropic expansion Process 4-1: Isobaric heat rejection Isentropic Process: Adiabatic and reversible process.

E N D
LAB 8:Steam Turbine(Rankine Cycle Experiment) ENTC - 370 PROF. ALVARADO
Rankine Cycle Process 1-2: Isentropic compression Process 2-3: Isobaric heat addition Process 3-4: Isentropic expansion Process 4-1: Isobaric heat rejection Isentropic Process: Adiabatic and reversible process PROF. ALVARADO
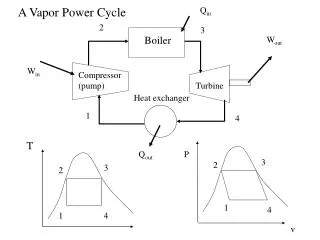
Experiment Set-up PROF. ALVARADO
From Lab Manual Tboiler =______°F Pboiler =______ psi Tturbine inlet =______°F Tturbineoutlet =______°F Record the current and voltage being supplied to the heater by using a fluke meter. Iin =______Amps Vin =______Volts Record the current and voltage produced by the generator: Iout =______Amps Vout =______Volts PROF. ALVARADO
Data analysis Power produced by generator: Power consumed by the whole system: Overall efficiency PROF. ALVARADO
Data analysis Isentropic efficiency of steam turbine: PROF. ALVARADO
Data analysis Estimation of the steam mass flow rate (assume ηgenerator=65%): Plot the entire Rankine Cycle on a T-s diagram using the pressure and temperature data recorded. PROF. ALVARADO


![An Introduction To Marine Steam Propulsion Plant [Source: US Navy]](https://cdn0.slideserve.com/482243/an-introduction-to-marine-steam-propulsion-plant-source-us-navy-dt.jpg)