Download
1 / 24
240 likes | 361 Vues
Charge Collection in irradiated Si Sensors. Monitoring the health of the Charge Collection System New Parameter: Efficiency Voltage Correlation between efficiency and cluster size. C. Betancourt, B. Colby, N. Dawson, V. Fadeyev M. Gerling, F. Hurley,

E N D
Charge Collection in irradiated Si Sensors • Monitoring the health of the Charge Collection System • New Parameter: Efficiency Voltage • Correlation between efficiency and cluster size C. Betancourt,B. Colby, N. Dawson,V. FadeyevM. Gerling, F. Hurley, S. Lindgren, P. Maddock, H. F.-W. Sadrozinski,S. Sattari, J. v. Wilpert, J. Wright SCIPP, UC Santa Cruz Hartmut Sadrozinski, SCIPP, UC Santa Cruz
Charge Collection and C-V Measurementsin irradiated Si Sensors • Monitoring the health of the Charge Collection System • New Parameter: Efficiency Voltage • Correlation between efficiency and cluster size • Admittance Measurement C. Betancourt,B. Colby, N. Dawson,V. FadeyevM. Gerling, F. Hurley, S. Lindgren, P. Maddock, H. F.-W. Sadrozinski,S. Sattari, J. v. Wilpert, J. Wright SCIPP, UC Santa Cruz Hartmut Sadrozinski, SCIPP, UC Santa Cruz
Radial Distributionof Sensors determined by Occupancy < 2%, still emerging LongStrips ShortStrips Pixels Fluence in the sATLAS Tracker “du jour” 5 - 10 x LHC Fluence Mix of n, p, pdepending on radius R Strips damage largely due to neutrons Pixels Damage due to neutrons+pions ATLAS Radiation Taskforce http://atlas.web.cern.ch/Atlas/GROUPS/PHYSICS/RADIATION/RadiationTF_document.html Design fluences for sensors (includes 2x safety factor) :B layer (r=3.7 cm) 2.5*1016 neq/cm2 1140 MRad Innermost Pixel Layer (r=5cm): 1.4*1016 neq/cm2 712 MRad 2nd Pixel Layer (r=7cm): 7.8*1015 neq/cm2 420 MRad Outer Pixel Layers (r=11cm): 3.6*1015 neq/cm2 207 MRad Short strips (r=38cm): 6.8*1014 neq/cm2 30 MRadLong strips (r=85cm): 3.2*1014 neq/cm2 8.4 MRad Hartmut Sadrozinski, SCIPP, UC Santa Cruz
Towards Commercialization of P-type 6” : Micron (RD50) HPK: (ATLAS07) 4” : IRST (SMART) n-on-n, p-on-n, n-on-p FZ and Mcz Testing: UC Santa Cruz, Liverpool U. , Ljubljana n-on-n, p-on-n, n-on-p FZ and Mcz n-on-p, FZ Hartmut Sadrozinski, SCIPP, UC Santa Cruz
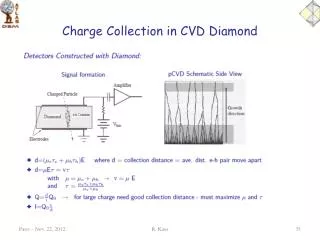
Charge Collection System Measurement of collected charge with min. ion. particles (MIPs) combines all effects of radiation damage: depletion voltage increase, inversion, trapping… CCE System is beta source (90Sr) with trigger from single thick scintillation counter. Measurements carried out in freezer at low temperature (-30 oC) Binary readout with 100 ns shaping time Positive and negative charge readout Accelerated Annealing at elevated temperature (60oC): about 440 times faster than at RT: 1000 min @ 60oC = 305 days at RT Activation energy E = 1.28 eV (Ziock et al. 1994) Annealing important for thermal management. 5 Hartmut Sadrozinski, SCIPP, UC Santa Cruz
Collected Charge: CCE Determination of collected charge 1. statistical: binary Threshold curves -> Efficiency -> Median Q (50% efficiency point) 2. event-by-event: analog Time-over-Threshold ToT -> peak of distribution -> ToT Q Good agreement between MedQ and ToT Accuracy: ~10% sample-to-sample few % within one sample during anneal. N.B. Complicated bias dependence!! 6 Hartmut Sadrozinski, SCIPP, UC Santa Cruz
Collected Charge and Single Rate Sensor single rate is crucial for health of apparatus. Single rate can foretell problems in charge collection measurement, which can’t be detected efficiency or collected charge or leakage current Hartmut Sadrozinski, SCIPP, UC Santa Cruz
Depletion Voltage Efficiency Voltage Collected Charge, Single Rates and Efficiency Sensor single rate at 1 fC threshold is tracking the median collected charge well. Efficiency at 1fC threshold saturates at much lower voltage and reaches 100% if signal/threshold S / T > 2,2 Signal/Noise > 9 in the experiment Determine the required voltage for 98.5% efficiency: “Efficiency Voltage” (e.g. 1 fC threshold) Hartmut Sadrozinski, SCIPP, UC Santa Cruz
Collected Charge and Efficiency Complete universal correlation between collected charge and efficiency Hartmut Sadrozinski, SCIPP, UC Santa Cruz
Efficiency Voltage (Threshold Dependence) Efficiency Voltage is threshold dependent. Threshold 1 fC -> 0.7 fC: gives reduction of Efficiency Voltage of 100-200 V. For stable operation: Breakdown Voltage >> Efficiency Voltage Hartmut Sadrozinski, SCIPP, UC Santa Cruz
Annealing of Efficiency Voltage (@ 1fC) Annealing benignfor all but p-on-n FZ Hartmut Sadrozinski, SCIPP, UC Santa Cruz
Annealing of Efficiency Voltage (@ 1fC) No big difference between proton/pion and neutron irradiation N-on-n MCz shows “typical n-type” annealing, but on a small scale. Hartmut Sadrozinski, SCIPP, UC Santa Cruz
Comparison Efficiency Voltage - Vfd If one adjust the Efficiency voltage with difference in fluence, the Eff Voltage vs. Anneal curve will be above the Vfd curve, indicating that n-on-p MCz inverts with pion (also proton) irradiation. This is also seen in the Vfd as a function of fluence curve. Hartmut Sadrozinski, SCIPP, UC Santa Cruz
Comparison Efficiency Voltage - Vfd Once the Efficiency voltage is scaled with the fluence, it would clearly be much larger than the Vfd for either Vfd fluence, indicating strong inversion of p-on-n FZ after proton irradiation For n-on-p FZ, it can be seen that at a given fluence, the efficiency voltage will be lower than Vfd, indicating no inversion after prtoton irradiation. This is consistent with the p-on-n FZ being inverted (bulk becomes more p-type) Hartmut Sadrozinski, SCIPP, UC Santa Cruz
What to do with C-V Measurements? • “C-V” • means here “ learn something about the depletion of the sensor, to be used to predict CCE or learn something about the state of the sensor when compared to CCE” • At least 4 diferent approaches: • Measure C-V at 10 kHz and low temperature: wrong • Measure C-V at R.T and 10 kHzless less wrong, good convention • (Gregor showed is ~ ok for diodes: Vdep(CEE) =Vdep(CV) within 200V) • Measure C-V at lower temperature, adjust frequency C-V(f,T) better • Measure Admittance, extract the width of the space charge region best ? Hartmut Sadrozinski, SCIPP, UC Santa Cruz
C-V(f,T) • Measure C-V at lower temperature, adjust frequency Measure C-V at lower temperature, adjust frequency to match according to the emission coefficicnt C-V(f,T). (usual current temperature dependence) M.K. Petterson, et al., RRESMDD06, Nucl. Inst. Meth. A 583, 189(2007) Hartmut Sadrozinski, SCIPP, UC Santa Cruz
Admittance • Measure Admittance, extract the width of the space charge region • Introduce Debye length to characterize non-abrupt junction(s) • Since trapping and de-trapping is important, measure both Capacitance C and Conductance G as a function of temperature T and frequency w Frequency dependence of conductance reveals dynamics of trapping C, Betancourt , et al., RRESMDD08, IEEE 2009, Senior Thesis Measured and simulated C and G/ω as a function of frequency for a pion irradiated n-type FZ detector taken at 100V and 22 degrees C Hartmut Sadrozinski, SCIPP, UC Santa Cruz
Results of Admittance Measurement Extracted depth of the space charge region from CCE andAdmittance p-on-n FZ pion irradiated sensor and diode n-on-p MCz neutron irradiated Sensor and diode Hartmut Sadrozinski, SCIPP, UC Santa Cruz
Results of Admittance Measurement Depleted depth of the space chare region for various pion detectors Extracted from Admittance measurements Hartmut Sadrozinski, SCIPP, UC Santa Cruz
Clustersize and Efficiency Cluster size is given by the “Cluster Ratio” = # of clusters with multiple strips / # of clusters with one strips Good Correlation, p-on-n FZ inverted. Hartmut Sadrozinski, SCIPP, UC Santa Cruz
Clustersize and Efficiency Cluster size changes during annealing for n-type FZ Hartmut Sadrozinski, SCIPP, UC Santa Cruz
Clustersize and Efficiency All p-type ~ same ? Hartmut Sadrozinski, SCIPP, UC Santa Cruz
Conclusions For charge collection studies, the health of the system can be determined by monitoring the singles rate. It signals breakdown and thus unphysical behavior even before the leakage current or the collected charge do it. In order to quantify the performance, we introduce the “efficiency voltage” as the bias voltage at which the efficiency reaches 100%. Very little annealing is observed, with the exception in p-on-n FZ. The efficiency voltage for p-type material is about the same for FZ and MCz in this fluence range. Comparison between efficiency voltage for SSD and full depletion voltage Vfd of diodes permits insight into the fact of “inversion”. The correlation of the efficiency with the clustersize is uniform across many different sensor types, particle species during irradiation, and anneal steps (with the exception of the p-on-n FZ sensors,) Admittance allows extraction the depth of the depleted region of irradiated sensors Hartmut Sadrozinski, SCIPP, UC Santa Cruz
Acknowledgments Thanks to the foundries and institutes who supplied sensors in a collaborative manner staff in Ljubljana, Louvain, CERN, Karlsruhe, PSI, BNL, LANL, UCSC for carrying out the irradiations. RD50 and ATLAS07 collaborators andthe many students who spend their evenings and nights taking and analyzing the data. Hartmut Sadrozinski, SCIPP, UC Santa Cruz