Download
1 / 13
130 likes | 282 Vues
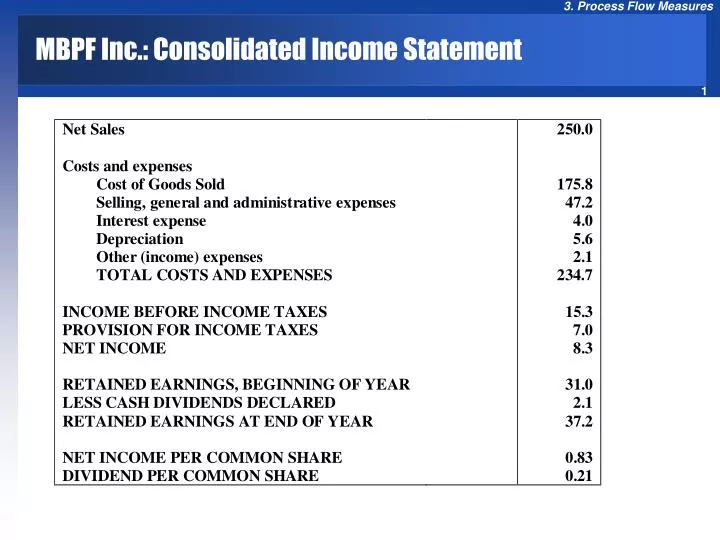
MBPF Inc.: Consolidated Income Statement. MBPF Inc.: Balance Sheet. MBPF Inc.: Balance Sheet. Compute average flow time through Accounts Receivable. A flow unit here is a dollar of Accounts Receivable Throughput R AR = $250 million/year (net sales from income statement)

E N D
MBPF Inc.: Balance Sheet Compute average flow time through Accounts Receivable. A flow unit here is a dollar of Accounts Receivable Throughput RAR = $250 million/year (net sales from income statement) Average Inventory IAR = $27.9 million (from the balance sheet) TAR = IAR/RARTAR = $27.9/$250 TAR = 0.112 years or 5.80 weeks After a sale is made, the firm must wait almost 6 weeks before sales dollars are collected! Decreasing this lag time between sale and collection can dramatically improve cash flow for the company to route to other needs! Compute average flow time of Accounts Payable. Flow unit here is $1 of AP Average accounts payable (inventory in purchasing) is $11.9 million = IAP Throughput RAP= Purchased Raw Materials + Purchased Parts RAP= $50.1 million + $40.2 million = $90.3 Million TAP = IAP/RAP TAP = 11.9 / 90.3 TAP= 0.13 years or 6.9 weeks to pay a bill.
MBPF Inc.: Inventory and Cost of Goods Compute the average flow time in production operations: I = TR I = Total Inventory, R = Cost of Goods Sold T = $50.6MM (value of inventory) / $175.8 MM (Annual COGS) T = 0.288 years or 15 week It takes 15 weeks for a dollar invested in the factory to be billed to a customer.
Analyzing Financial Flows: Cash-to-Cash Cycle • Cost-to-Cash Cycle: Measures time between the point that cost dollars are invested • and sales dollars are received. • Cost-to-Cash-Cycle:MBPF Inc. = + 15 weeks in production • + 5.8 weeks in AR after the point of sale • Cost-to-Cash-cycle = 20.8 weeks • Cash-to-Cash Cycle: Similar, but nets out lag time in AP. • MBPF Inc. pays for the cost dollar 6.9 weeks after a purchase (cost) is made. • Cash-to-Cash-Cycle:MBPF Inc. = + 15 weeks in production • + 5.8 weeks in AR after the point of sale • - 6.9 weeks in AP after the point of purchase • Cash-to-Cash-cycle = 14.1 weeks
Analyzing Financial Flows: Improvement with Flow Analysis • Throughput (R) of each department: the cost of inputs + the cost of • human and capital resources (labor, equipment, building, etc.) • For MBPF, throughput in fabrication is: $50.1 million/year in raw materials + $60.2 million in labor and overhead • R = $110.3 million/year total throughput. • Flow Analysis is important in order to improve process performance. • Conduct a detailed flow analysis of each step of the process. • Identify the area within a process that can benefit the most from improvements
Row Material and Resources $60.2/yr $25.3/yr $50.1/yr Raw Materials (roofs) Fabrication (roofs) $40.2/yr Assembly Finished Goods Purchased Parts (bases)
Throughput and Inventories at Different Processes $60.2/yr $25.3/yr $110.3/yr $50.1/yr $6.5 $15.1 Raw Materials (roofs) Fabrication (roofs) $175.8/yr $175.8/yr $10.6 $9.8 $40.2/yr Assembly Finished Goods $8.6 $40.2/yr Purchased Parts (bases)
Flow rate R ($/week) 4.8 3.38 Accounts Receivable 2.12 Assembly Finished Goods Fabrication 0.96 Raw Materials 0.77 Purchased Parts 11.12 5.80 6.75 3.14 2.90 7.12 Flow Time T (weeks) Flow Rate vs. Flow Time
Analyzing Financial Flows: Improvement with Flow Analysis • Working capital in each department includes the amount of inventory in it. • Flow time here is the amount of time a cost dollar spends (on average) in that department. • We can then ask, “in which department does a reduction in flow time have the greatest impact on working capital?” • The larger the current flow time, the greater an impact in decreasing flow time will have on reducing working capital. • In the MBPF example, we learn that a 1 week reduction in AR would free up approximately $5MM to the firm!
Inventory Turns (Turnover Ratio) • How many times has your inventory been sold and then replaced • during the given time period? • Inventory Turns = Cost of Good Sold / Average Inventory = R / I • Little’s Law: I = RT Inventory Turns = R / RT 1/T • Inventory Turns is the reciprocal of average flow time. • Inventory turns at MBPF • Inventory Turns = ($175.8MM (Total throughput per year) / $50.6MM (Avg. Inv) = 3.47 Turns per year
Flow rate R ($/week) 6 5 AR 4 Assembly FG 3 Fabrication 2 Purchased Parts 1 RM 0 0 0.1 0.2 0.3 0.4 Effort to cut flow time: 1/T (1/weeks) Flow Rate vs. Inventory Turns