Download
1 / 44
440 likes | 598 Vues
Use of GIS in the Climatology of Snow-to-Liquid Equivalent R atio. Matt Taraldsen University of Minnesota MGIS Candidate. Overview. Background Objective Study Data Methodology Results Conclusions Future Improvements. Background. 2010 – BS in Meteorology, Saint Cloud State

E N D
Use of GIS in the Climatology of Snow-to-Liquid Equivalent Ratio Matt TaraldsenUniversity of MinnesotaMGIS Candidate
Overview • Background • Objective • Study Data • Methodology • Results • Conclusions • Future Improvements
Background • 2010 – BS in Meteorology, Saint Cloud State • Current MGIS Student, University of MN • Past employment with National Weather Service • Research interest of combining GIS and hydrometeorology, emergency management
NPWSC 2011 • Wanted a project to combine GIS and Meteorology • Sent some emails • Rod replied – physical meteorology project • Build a climatology
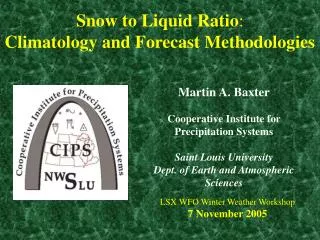
Snow-to-Liquid Ratio (SLR) • Measure of liquid content of snow • Multiply QPF by SLR to get predicted snowfall • Common meteorology folklore: 10” of snow to 1” of liquid precipitation • First reported in Henry (1917)
SLR • 10:1 disproven by: LaChapelle 1962;Grant and Rhea 1974; Doesken and Judson 1996; Super and Holroyd 1997; Judson and Doesken 2000; Roebber et al. 2003 • “10:1 SLR is both dependent on the thermodynamic state of the atmosphere and is rarely achieved”
“Thermodynamic State” Snow Crystals, Natural and Artificial UkichiroNakaya (1954)
Measuring Temperature While comparing various numerical models, the National Weather Service (NWS) has found that climatology and surface temperatures can be implemented to predict the SLR (U.S. Department of Commerce 1996).
Objective • Saw an opportunity to build a more comprehensive local climatology – one for local forecasters • Other SLRs have since been developed (Baxter et. al 2004, Baxter 2005), but for entire US.
Previous Climatology Baxter 2011 (web) MN State Climatology
Study Data Minnesota is fortunate:1) NWS observations2) Community Collaborative Rain, Hail, and Snow Network (CoCoRaHS)3) Minnesota State Climatologist High Density (HIDEN) Network
Study Data Error Potential : 40 – 50%DeRung, D.E., "Snowfall Water Equivalent Comparison of Eight Inch Standard Gauge Versus Heated Tipping Bucket," September 1990
Study Data • Downloaded over 6000 observations from 2009 - 2011 • 2000 additional HIDEN observations acquired, not yet ingested • 1314 reports with linked temperatures • Combining with CoCoRaHS data, a total of 4757 observations of SLR were retrieved
Study Data • Assume data to be error free • Assume standard operating procedure • Neither dataset included information about wind speeds or dewpoints (Meister 1986)
Methodology • Imported data into Excel, then into Arc GIS • Also downloaded Minnesota County shapefile from DNR Data Deli • All data in WGS 1984 coordinates • SLR calculated by dividing snowfall attributes by precipitation
Methodology • Needed to convert points to raster image • Needed a raster that:1)Maintained spatial artifacts in data2)Tolerate highly irregular observation distribution3)Could easily generate contours of constant values Solution was TINs
Triangular Irregular Networks (TINS) • Commonly used to build terrain maps • Old, somewhat antiquated GIS product • No Smoothing • Good for maintaining constant spatial trends • Can easily deal with very “noisy” data
TINS From Esri, 2008
Downside • Hard to clip • Cannot manually edit • Without hillshade, sometimes has bulls eye appearance
Conclusions • Statistical mean SLR for MN was 16.1:1 • Maps gave temporal aspect of SLR • Also wanted by frequency, county warning area, and temperature
Conclusions From Baxter et. al 2004
Conclusions Univariable model of SLR based on station average temperature
The future • HIDEN data! • More Accuracy Assessments
Special Thanks • Rod Kubesh (SCSU AHS) • Pete Boulay (Minnesota State Climatologist) • Marv Bauer (UMN Forest Resources) • Susanna McMaster (UMN GIS) • Michelle Margraf (NWS MPX) • Amanda Graning (NWS DLH)
Works Cited • http://images.nationalgeographic.com/wpf/media-live/photos/000/002/cache/hurricane-ivan_200_600x450.jpghttp://climate.umn.edu/snowrules/http://www.nws.noaa.gov/om/coop/reference/Snow_Measurement_Guidelines_05-1997.pdfhttp://www.cocorahs.org/media/docs/Measuring%20Snow-National-Training%201.1.pdfhttp://www.nws.gov/asos/tipbucket.html • http://help.arcgis.com/en/arcgisdesktop/10.0/help/index.html#/What_is_a_TIN_surface/006000000001000000/ • http://1.bp.blogspot.com/_wlGMu4FMLvE/TA7Eoq-mscI/AAAAAAAAATs/tnlnDXPTD_U/s1600/soundinglocations.gifSnow Crystals, Natural and Artificial UkichiroNakaya (1954) • Baxter, Martin A. "Snow to Liquid Ratio: Climatology and Forecast Methodologies." Snow to Liquid Ratio: Climatology and Forecast Methodologies. Proc. of National Weather Service Saint Louis, MO Weather Workshop, Saint Louis, MO. Web. 12 Apr. 2012. <www.crh.noaa.gov/Image/eax/science/Snow_liquid_ratio.ppt>. • Baxter M, Graves C, Moore J. “A Climatology of Snow-to-Liquid Ratio for the Contiguous United States. Weather and Forecasting October 2005; 20(5); 729-744. Ipswich, MA. Accessed April 12, 2012 • "CoCoRaHS - Community Collaborative Rain, Hail & Snow Network." CoCoRaHS. CoCoRaHS, 2011. Web. 12 Apr. 2012. <http://www.cocorahs.org/Content.aspx?page=aboutus>. • "CoCoRaHS - Community Collaborative Rain, Hail & Snow Network." CoCoRaHS. MN CoCoRaHS, 2011. Web. 12 Apr. 2012. <http://www.cocorahs.org/state.aspx?state=mn>. • DeRung, D.E., "Snowfall Water Equivalent Comparison of Eight Inch Standard Gauge Versus Heated Tipping Bucket," September 1990 • Doesken, N., and A. Judson, 1996: The Snow Booklet: A Guide to the Science, Climatology, and Measurement of Snow in the United States. Colorado State University, 86 pp. • ESRI, . "TINs." Arc 10.0 Desktop Help. N.p., 2009. Web. 25 Sep 2012. <http://help.arcgis.com/en/arcgisdesktop/10.0/help/index.html> • Grant, L., and J. Rhea, 1974: Elevation and meteorological controls on the density of snow. Interdisciplinary Symp. on Advanced Concepts and Techniques in the Study of Snow and Ice Resources, Monterey, CA, National Academy of Science, 169–181. • Henry, A., 1917: The density of snow. Mon. Wea. Rev., 45, 102–113. • "HIDEN Minnesota Climate Networks - MAIN." Minnesota Climatology Working Group. Minnesota State Climatology Office, 2009. Web. 12 Apr. 2012. <http://climate.umn.edu/hidensityedit/hidenweb.htm>. • Jiusto, J., and H. Weickmann, 1973: Types of snowfall. Bull. Amer. Meteor. Soc., 54, 1148–1162. • Judson, A., and N. Doesken, 2000: Density of freshly fallen snow in the central Rocky Mountains. Bull. Amer. Meteor. Soc., 81, 1577–1587. • Kubesh, Rodney. Personal Interview. 10 Sept 2012. • National Weather Service, . "Winter Weather Forecasting."National Weather Service. National Weather Service Louisville, 2009. Web. 25 Sep 2012. <http://www.crh.noaa.gov/lmk/?n=winter-precip>. • "National Weather Service-Automated Surface-Observing System." National Weather Service-Automated Surface-Observing System. US Department of Commerce, 12 Apr. 2012. Web. 12 Apr. 2012. <http://www.ngdc.noaa.gov/nndc/struts/>. • "National Weather Service Weather Forecast Office." Water Equiv NWS Quad Cities, IA IL. National Weather Service, 2011. Web. 12 Apr. 2012. <http://www.crh.noaa.gov/dvn/?n=toolswaterequiv>. • Roebber, P., S. Bruening, D. Schultz, and J. Cortinas, 2003: Improving snowfall forecasting by diagnosing snow density. Wea. Forecasting, 18, 264–287. • Super, A., and E. Holroyd, 1997: Snow accumulation algorithm for the WSR-88D radar: Second annual report. U.S. Dept. of Interior Tech. Rep. Bureau Reclamation R-97-05, Denver, CO, 77 pp. [Available from National Technical Information Service, 5285 Port Royal Rd., Springfield, VA 22161.] • U.S. Department of Commerce, 1996: Supplemental observations. Part IV, National Weather Service Observing Handbook No. 7, Surface Weather Observations and Reports, National Weather Service, Silver Spring, MD, 57 pp. • Wilks, D. S., 1995: Statistical Methods in the Atmospheric Sciences. Academic Press, 465 pp.