Download
1 / 24
240 likes | 248 Vues
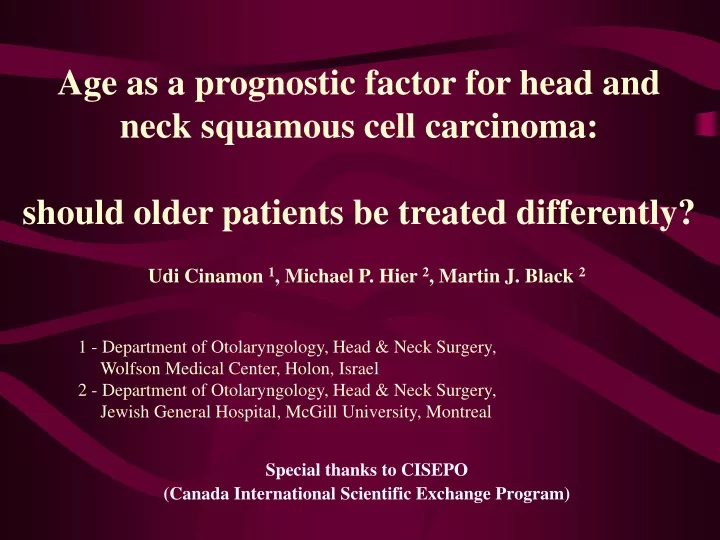
Age as a prognostic factor for head and neck squamous cell carcinoma: should older patients be treated differently?. Udi Cinamon 1 , Michael P. Hier 2 , Martin J. Black 2 1 - Department of Otolaryngology, Head & Neck Surgery, Wolfson Medical Center, Holon, Israel

E N D
Age as a prognostic factor for head and neck squamous cell carcinoma: should older patients be treated differently? Udi Cinamon 1, Michael P. Hier 2, Martin J. Black 2 1 - Department of Otolaryngology, Head & Neck Surgery, Wolfson Medical Center, Holon, Israel 2 - Department of Otolaryngology, Head & Neck Surgery, Jewish General Hospital, McGill University, Montreal Special thanks to CISEPO (Canada International Scientific Exchange Program)
Children should not be treated as small adults !!! Should elderly patients be treated differently?
Introduction: • Improved medical care • New surgical techniques, i.e., reconstructive surgery • Progress in the field of anesthesia Enable a more aggressive treatment to patients with HNSCC. HOWEVER Feasibility = appropriateness?
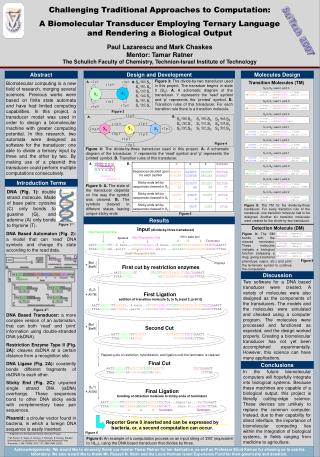
2003 Canada Male Female Canada Male Female Age group Persons (thousands) % of total of each group Total 31,629.7 15,661.7 15,967.9 100.0 100.0 100.0 0–4 1,714.3 877.3 837.0 5.4 5.6 5.2 5–9 1,949.7 998.6 951.1 6.2 6.4 6.0 10–14 2,117.6 1,084.8 1,032.9 6.7 6.9 6.5 15–19 2,120.5 1,088.8 1,031.8 6.7 7.0 6.5 20–24 2,188.5 1,119.0 1,069.5 6.9 7.1 6.7 25–29 2,118.1 1,074.0 1,044.2 6.7 6.9 6.5 30–34 2,228.7 1,124.8 1,103.9 7.0 7.2 6.9 35–39 2,481.2 1,247.4 1,233.8 7.8 8.0 7.7 40–44 2,719.3 1,364.3 1,355.0 8.6 8.7 8.5 45–49 2,515.7 1,251.6 1,264.2 8.0 8.0 7.9 50–54 2,176.5 1,078.8 1,097.7 6.9 6.9 6.9 55–59 1,842.5 913.9 928.5 5.8 5.8 5.8 60–64 1,396.8 684.8 712.0 4.4 4.4 4.5 65–69 1,147.9 552.2 595.7 3.6 3.5 3.7 70–74 1,039.1 484.2 554.9 3.3 3.1 3.5 75–79 839.4 358.8 480.7 2.3 3.0 80–84 583.7 221.6 362.0 1.8 1.4 2.3 85–89 297.0 97.2 199.7 0.9 0.6 1.3 90 and over 153.1 39.8 113.3 0.5 0.3 0.7 Note: Population as of July 1. Source: Statistics Canada, CANSIM II, table 051-0001. Last modified: 2003-11-06. 2.7
2003 Canada Male Female Canada Male Female Age group Persons (thousands) % of total of each group Total 31,629.7 15,661.7 15,967.9 100.0 100.0 100.0 0–4 1,714.3 877.3 837.0 5.4 5.6 5.2 5–9 1,949.7 998.6 951.1 6.2 6.4 6.0 10–14 2,117.6 1,084.8 1,032.9 6.7 6.9 6.5 15–19 2,120.5 1,088.8 1,031.8 6.7 7.0 6.5 20–24 2,188.5 1,119.0 1,069.5 6.9 7.1 6.7 25–29 2,118.1 1,074.0 1,044.2 6.7 6.9 6.5 30–34 2,228.7 1,124.8 1,103.9 7.0 7.2 6.9 35–39 2,481.2 1,247.4 1,233.8 7.8 8.0 7.7 40–44 2,719.3 1,364.3 1,355.0 8.6 8.7 8.5 45–49 2,515.7 1,251.6 1,264.2 8.0 8.0 7.9 50–54 2,176.5 1,078.8 1,097.7 6.9 6.9 6.9 55–59 1,842.5 913.9 928.5 5.8 5.8 5.8 60–64 1,396.8 684.8 712.0 4.4 4.4 4.5 65–69 1,147.9 552.2 595.7 3.6 3.5 3.7 70–74 1,039.1 484.2 554.9 3.3 3.1 3.5 75–79 839.4 358.8 480.7 2.3 3.0 80–84 583.7 221.6 362.0 1.8 1.4 2.3 85–89 297.0 97.2 199.7 0.9 0.6 1.3 90 and over 153.1 39.8 113.3 0.5 0.3 0.7 Note: Population as of July 1. Source: Statistics Canada, CANSIM II, table 051-0001. Last modified: 2003-11-06. 2.7
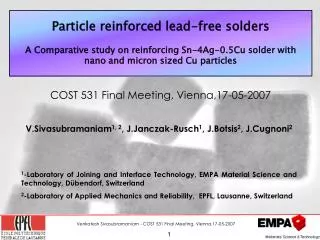
Incidence Age Mortality Age 75
In Israel / Canada the average age: 75-♂ / 82-♀ Living in an aging society: We may expect to treat more seniors with HNSCC
Objective: • To explore the issue of proper treatment in an aging society. • To address the question: feasibility = appropriateness?
Methods: A retrospective study of the treatment outcome for patients that were primarily treated on our service 1990-1999. Patients ≥ 75 years with HNSCC of the oral cavity, pharynx and larynx.
Results: • 40 Pts • 75-99 years (average, 82.2) • 26♂ and 14♀
Distribution of patients according to stage and primary site of tumor.
Co-morbidityPre – treatment medical evaluation according to theASAClassification of Physical Status system.
Major complications for 36 Pts treated for cure • Post operative mortality - 2 • Cessation of radiotherapy - 1 • Free flap complication - 1 • Hospital stay > 6 weeks - 3
Treatment outcome and survival data: 4 Pts - Stage IV received palliative radiotherapy. Dead of disease after 4 months (2-6 mon.). 2 Pts that were treated with a curative intention: Postoperative mortality 34 Pts that were treated with a curative intention: • 11 - Recurrence • 2 - Metastasis Survival of the 34 Pts. was 4.7 years (3 mon.–11y) .
Treatment outcome and survival data: • Stage I: 15 Pts: Average follow up - 6 years. • 3 Pts had a recurrence and treated. None died from cancer related causes. • Stage II: 3 Pts: one died after 2 years with no evidence of disease. Second patient recurred after one year, treated, and is alive 4 years after with NED. The third recurred locally after 9 months, for which he was treated surgically. He had a fatal myocardial infarction a week after his operation. • Stage III: 5 Pts: One had a jejunum free flap and died of post-operative complications. • Two are alive with NED after 6 years, another died after 4 years with NED, the fourth had a recurrence after 5 years and died soon after from an un-related cause. • Stage IV: 13 Pts: five were dead of disease within 3-15 months, two with distant metastasis. One patient recurred had a fatal MI a week after been treated surgically. One died 9 months after treatment having an acute MI. Two died with NED after 4 and 6 years. One patient was free of disease for 10 years and died from lung cancer. Three patients are living with NED after 5, 6, and 7 years, the latter had a recurrence after one year that was treated surgically.
Discussion: An intention to cure HNSCC necessitates a vigorous treatment which by itself may jeopardize the patient. Investigation of the association between age and treatment-outcome reveals conflicting opinions.
Main outcome of studies: • Koch et al.(1995), McGuirt & Davis (1995): Older Pts have more complications. • Clayman et al. (1998): same complication rate and almost the same recurrence & mets rate.
Main outcome of studies: • Shaari et al. (1998,1999), Blackwell et al.(2002), studies of surgical+free flap outcome: Seniors have more medical complications and almost the same flap/surgical complication rate. • Sarini et al. (2001); 273 Pts≥75y. Decision making according to age: older→less aggressive treat; more XRT/ less surgery Almost the same results as younger Pts.
Main outcome of studies:Hirano & Mori (1998): The treatment outcome of 37 patients that were eligible for curative treatment but preferred palliative treatment was significantly worse compared to those treated for cure.
Summary: Decision making: Age was not an exclusion factor from receiving curative treatment. Pts. medically eligible → for curative treatment. The survival of Pts. treated for cure was 4.7 years, while the life expectancy of the general population (of 82 y old) is about the same (6.3 y). Conclusion: Seniors having HNSCC do benefit from curative treatment. Therefore, exclusion from receiving such treatment should be based, as for younger subjects, on a careful individual basis.