Download
1 / 86
860 likes | 867 Vues
9/13/13 Aim: How and why do psychologists produce valid research?. Do Now: Fill out the survey. Aim: How do biases contaminate our everyday judgments?. Do now: I need 5 volunteers – raise your hand if you want to volunteer. Truth/lie % of your confidence 50 guess

E N D
9/13/13 Aim: How and why do psychologists produce valid research? • Do Now: Fill out the survey.
Aim: How do biases contaminate our everyday judgments? • Do now: I need 5 volunteers – raise your hand if you want to volunteer. • Truth/lie % of your confidence 50 guess • 100 % totally sure • 1 • 2 • 3 • 4
Overconfidence Sometimes we think we know more than we actually know. Anagram How long do you think it would take to unscramble these anagrams? WREAT WATER ETYRN ENTRY People said it would take about 10 seconds, yet on average they took about 3 minutes. GRABE BARGE
Hindsight Bias Hindsight Biasis the “I-knew-it-all-along” phenomenon. After learning the outcome of an event, many people believe they could have predicted that very outcome. We only knew the dot.com stocks would plummet after they actually did plummet. Show clip.
Confirmation Bias • We seek to find information that confirms what we already know. • How does the Seinfeld clip show confirmation bias? Explain.
False Consensus Effect • The tendency to overestimate how much other people agree with you. There is a tendency for people to assume that their own opinions, beliefs, preferences, values and habits are 'normal' and that others also think the same way that they do. • Show clip
Aim: What are the Goals of Research - • Do Now: copy the statements (leave room) • Placebo • Explain about lie detectors • Explain Hite research • What is correlation
9/15 Aim: What are the 3 goals of psychological research? • Do Now: Set up an experiment to determine if viewing Spongebob causes decreased ability to focus in academic tasks in young viewers
9/19 Aim: How do experiments, powered by random assignment, clarify cause and effect? • Do Now: Identify the difference between the following: • Random sample • Random assignment • Also, what is the placebo effect? • After the clip, answer “How does the clip show a placebo effect?”
The Need for Psychological Science Intuition & Common Sense Many people believe that intuition and common sense are enough to bring forth answers regarding human nature. Intuition and common sense may aid queries, but they are not free of error.
Psychological Science • How can we differentiate between uniformed opinions and examined conclusions? • The science of psychology helps make these examined conclusions, which leads to our understanding of how people feel, think, and actas they do!
The Scientific Attitude The scientific attitude is composed of curiosity (passion for exploration), skepticism (doubting and questioning) and humility (ability to accept responsibility when wrong).
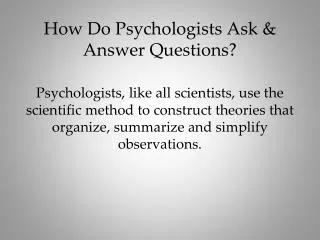
Scientific Method Psychologists, like all scientists, use the scientific method to construct theories that organize, summarize and simplify observations.
Research Observations Research would require us to administer tests of self-esteem and depression. Individuals who score low on a self-esteem test and high on a depression test would confirm our hypothesis.
Aim: What are the goals of psychological research? • 1. describe behavior • 2. predict behavior • 3. determine cause and effect
Describe behavior has 3 tools • Case Study • Survey • Naturalistic Observation
Prediction has 1 tool • Correlation
Determine cause and effect has one tool • Experimentation
Describe behavior – CASE STUDY Case Study A technique in which one person is studied in depth to reveal underlying behavioral principles. Advantages – get to know one person in depth Disadvantage – cannot generalize findings to population
Describe behavior - Survey A technique for questioning the self-reported attitudes, opinions or behaviors of people Advantages inexpensive, easy to collect data, easy to generalize – used in conjunction with correlations Disadvantages – may not be honest, wording effects may confuse people, may not be a representative sample (Hite research) Terms - representative, random sample, generalize. Social desirability bias – people answer how they think others want them to answer
Survey - disadvantages False Consensus Effect A tendency to overestimate the extent to which others share our beliefs and behaviors.
Describe behavior - Naturalistic Observation Observing and recording the behavior of people/animals in the wild and recording self-seating patterns in a multiracial school lunch room constitute naturalistic observation. Advantages – realistic data Disadvantages – could interfere with behaviors, no control like a lab
9/18 Aim: What are positive and negative correlations, and why do they enable prediction but not cause-effect explanation? • Copy Aim onto top of worksheet
Indicates direction of relationship (positive or negative) Correlation coefficient Indicates strength of relationship (0.00 to 1.00) Correlation – used to predict behavior When we reveal a relationship between two variables, the are correlated, used to predict Advantages – allow for prediction, collect data from surveys Disads - does not mean causation Correlation Coefficient is a statistical measure of the relationship between two variables. r = + 0.37
Terms: Scatterplots Perfect positive correlation (+1.00) Scatterplotis a graph comprised of points that are generated by values of two variables. The slope of the points depicts the direction, while the amount of scatter depicts the strength of the relationship.
Perfect negative correlation (-1.00) Perfect positive correlation (+1.00)
If two things are positively correlated, the presence of one predicts the presence of the other • In contrast, a negative correlation means that the presence of one thing predicts the absence of the other • When no exists between two variables NO correlation exists.
Correlations can be either strong or weak. • The strength of a correlations is expressed by a number called correlationcoefficient • -1 and + 1 are both very strong . The number 0 denotes a weak relationship. • Describe a r= -.12 _______________________
Scatterplots Perfect negative correlation (-1.00) No relationship (0.00) The Scatterplot on the left shows a negative correlation, while the one on the right shows no relationship between the two variables.
Data Data showing height and temperament in people.
Scatterplot The Scatterplot below shows the relationship between height and temperament in people. There is a moderate positive correlation of +0.63.
Illusory Correlation The perception of a relationship where no relationship actually exists. Ex: sugar makes children hyperactive
Order in Random Events Given random data, we look for order and meaningful patterns. Your chances of being dealt either of these hands is precisely the same: 1 in 2,598,960.
Order in Random Events Given large numbers of random outcomes, a few are likely to express order. Jerry Telfer/ San Francisco Chronicle Angelo and Maria Gallina won two California lottery games on the same day.
Aim: How do we use Experimentation To determine Cause and Effect Like other sciences, experimentation is the backbone of psychology research. Experiments isolate causes and their effects. Experiments (1)manipulate factors that interest us, while other factors are kept under (2) control Advantages – controlled environment Disadvantages – confounding variables – variables the may affect our data Terms – assignment of group members - -control/experimental, double blind, blind, placebo, experimenter bias
Exploring Cause & Effect Many factors influence our behavior.. Effects generated by manipulated factors isolate cause and effect relationships. Advantages – controlled environment Disadvantages – confounding variables, experimenter bias Terms – assignment, random, double blind, blind, placebo, control group, experimental group
Independent Variable An Independent Variable is a factor manipulated by the experimenter. The effect of the independent variable is the focus of the study.
Dependent Variable A Dependent Variable is a factor that may change in response to an independent variable. In psychology, it is usually a behavior or a mental process.
Operational Definitions • Clearly define your variables so that others can clearly replicate your research and get the same results (reliable) • Example: watching 9 minutes of Sponge Bob – Independent variable operationally defined
Example • Independent Variable – special juice • Dependent Variable – worker productivity • Exp Group – juice • Control – no juice • Always make your experimental group the Independent variable and it will be right!
Megan wants to test 3 different treatments on the cure of phobias. Subjects were exposed to one of the 3 possible treatments for a period of 3 months and are then tested for a reaction to their fear.
Evaluating Therapies Double-blind Procedure In evaluating drug therapies, patients and experimenter’s assistants should remain unaware of which patients had the real treatment and which patients had the placebo treatment.
9/20/13 What are the terms associated with good research? • On the bottom of yesterdays sheet, match the terms.
1. It all starts with a THEORY • Explanation using an integrated set of principles that organize and predicts observations and ideas
2. Population • all the cases in a group, from which samples may be drawn for a study
3. Valid • Does the research measure what it intends to measure • Ex: If you are trying to measure for intelligence but actually ask questions regarding physical tasks (jumping up and down, how fast you can run)
4. Replication • repeating the essence of a research study, usually w/ different participants in different situations, to see whether the basic finding extends to other participants and circumstances • Need to have clear operational definitions to replicate
5. Critical Thinking Critical thinking does not accept arguments and conclusions blindly. It examines assumptions, discerns hidden values, evaluates evidence and assesses conclusions.