Download
1 / 29
290 likes | 386 Vues
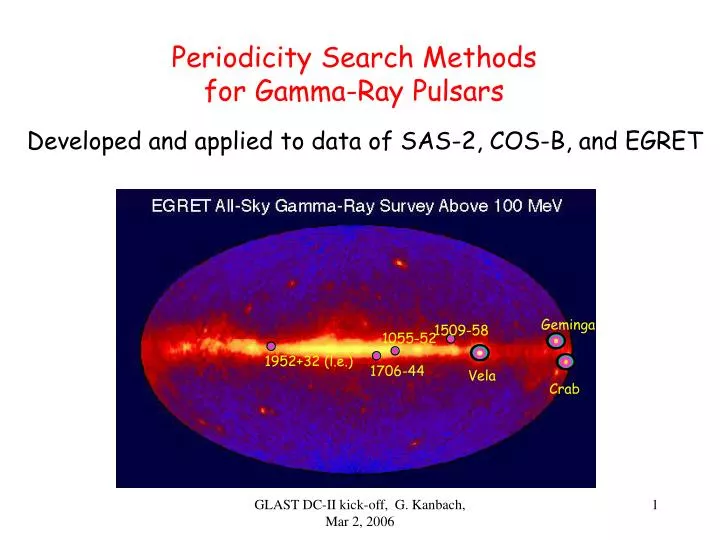
Periodicity Search Methods for Gamma-Ray Pulsars. Geminga. 1509-58. 1055-52. 1952+32 (l.e.). 1706-44. Vela. Crab. Developed and applied to data of SAS-2, COS-B, and EGRET. The gamma-ray sky (EGRET, >100 MeV). Characteristics of classical gamma-ray pulsar data:.

E N D
Periodicity Search Methodsfor Gamma-Ray Pulsars Geminga 1509-58 1055-52 1952+32 (l.e.) 1706-44 Vela Crab Developed and applied to data of SAS-2, COS-B, and EGRET The gamma-ray sky (EGRET, >100 MeV) GLAST DC-II kick-off, G. Kanbach, Mar 2, 2006
Characteristics of classical gamma-ray pulsar data: • small source detection rates: typical psr flux ~ 10-6g cm-2 s-1effective area ~ 102 – 103 cm2src detection rate 1 g / 103 – 104 sec • strong background: S/B ~ 0.1 - 1 • long integration times of days – weeks • no contemporaneous radio ephemeris available GLAST DC-II kick-off, G. Kanbach, Mar 2, 2006
High-EnergyLightcurves GLAST DC-II kick-off, G. Kanbach, Mar 2, 2006
Pulsar n-ndot Distribution Search region 1000 Hz 0.2 Hz 0.2 Hz 0.2 Hz GLAST DC-II kick-off, G. Kanbach, Mar 2, 2006
. How many test n, n do we have to investigate? Step-size: the ‚independent Fourier interval‘ GLAST DC-II kick-off, G. Kanbach, Mar 2, 2006
For a complete search: Assume a stretch of data that is 1 week long: tobs = 6x10⁵ sec f1=0.2 Hz to f2=1000 Hz : Sf ~ 103 x 6x105 x m ~ 109 f1,dot= 10-9 s-2 to f2,dot= 10-17 s-2 : Sfdot ~ 10-9 x 4x1011 x m ~ 103 Total number of searches: ~ 1012 GLAST DC-II kick-off, G. Kanbach, Mar 2, 2006
Steps to prepare data for a periodicity search: • extract photons from the map that belong (with a high probability) to the source : gtselect • apply barycentric time corrections : gtbary • derive periodicity indicators from the time series - folding and light curve assessment - Fourier transformation - any other method… • estimate significance and look for corroborating evidence GLAST DC-II kick-off, G. Kanbach, Mar 2, 2006
Step 1: extract photons from the map that belong (with a high probability) to the source: Simple: cookie cutter: gtselect Classical EGRET method based on PSF: Accept photons if q < 5.85° (E/100 MeV)-0.534 Refinement 1: apply a weight factor to photons dependent on angular distance and energy Refinement 2: accept photons if probability for origin from pulsar exceeds given threshold in view of the neighbouring sources and background GLAST DC-II kick-off, G. Kanbach, Mar 2, 2006
DC2 Counts Map: Galactic Anticenter Geminga Crab GLAST DC-II kick-off, G. Kanbach, Mar 2, 2006
DC2: Vela Region gtpsearch: 5° radius GLAST DC-II kick-off, G. Kanbach, Mar 2, 2006
Step 2: • apply barycentric time corrections: gtbary • Need: good source position dt SSC GLAST DC-II kick-off, G. Kanbach, Mar 2, 2006
Step 3: If needed: Preprocess time series to take into account period derivatives or binary motions (shrink or expand time scale): cancelpdot=yes derive periodicity indicators from the time series - folding and light curve assessment - Fourier transformation - any other method … estimate significance and look for corroborating evidence GLAST DC-II kick-off, G. Kanbach, Mar 2, 2006
Folding methods (1): • Calculate phases from time series (Taylor expansion): • = j(t) = j0 + fti + fdott2/2 + fddott3/6 + … Derive lightcurve: histogram mod(ji,1) in n phase bins Inspect resulting lightcurve for deviations from uniformity: Chi-square test: c2 = (xi - )2 1 n x x S i=1 GLAST DC-II kick-off, G. Kanbach, Mar 2, 2006
Folding methods (2): n 2 n + [ sin(2pkji)]2 } { [ cos(2pkji)]2 n m H max ( - 4m + 4) 2 2 Z Z 1 m 20 m m S S S i=1 k=1 i=1 Fourier power over m harmonics (Buccheri et al., 1983): = H-statistic test (De Jager et al., 1989): GLAST DC-II kick-off, G. Kanbach, Mar 2, 2006
Some basic mathematics for Fourier analysis of time series Given an event rate of the form: Z(t) = Sd(t-ti) where the ti are distributed uniformely in [0,T] Fourier Transform: X(f,T) = Z(t) e-i2pftdt = cos(2pfti) – i sin(2pfti) One sided Power Density: H(f)= |X(f,T)|2 = { [ N i=1 T T 0 0 + [ sin(2pfti)]2 } cos(2pfti)]2 2 2 N N N N S S S S N N i=1 i=1 i=1 i=1 GLAST DC-II kick-off, G. Kanbach, Mar 2, 2006
Following Buccheri, Özel, and Sacco, 1987: For random arrival times H(f) has a c2 probability distribution with 2 d.o.f. A periodic signal of Np counts (in total of N counts) concentrated in a duty cycle of a leads to a PDF of H‘ = 2+2aNp(Np-1)/N ~ Np2 / N and the significance is calculated from c22 : exp(-H(f)/2) If M trials were made S = M . exp(-H(f)max/2) GLAST DC-II kick-off, G. Kanbach, Mar 2, 2006
Significance limitations 2 N N p T Mattox et al., 1996: The significance of detection depends exponentially On the ratio: Source counts Total counts > 50 needed GLAST DC-II kick-off, G. Kanbach, Mar 2, 2006
Fourier Procedure: Apply to the selected set of arrival times: Calculate PDF for test frequencies spaced by the ‚independent Fourier interval‘ df = 1/T (eventually use oversampling by a factor of ~2-3) Sum PDF for series of harmonics to increase signal (use FFT like Mattox et al., 1996; Chandler et al., 2001) Check for significant peaks and derive light-curve etc. GLAST DC-II kick-off, G. Kanbach, Mar 2, 2006
FFT on a supercomputer Mattox et al., 1996 GLAST DC-II kick-off, G. Kanbach, Mar 2, 2006
Evolutionary Search • Brazier & Kanbach, 1996: • split T in shorter intervals • calculate full search in first interval • select significant frequencies • limit search in 2nd intl. to selected frequency regions • continue to rest • the signal survives… GLAST DC-II kick-off, G. Kanbach, Mar 2, 2006
Autocorrelation: Basic Idea(Marcus Ziegler et al.) Calculate the Fourier-Transform of the time differences of the photon arrival times Dtn. take only differences with Dt < max_diff typical max_diff = 10 000s ~ 3 hours typical EGRET viewingperiod ~ 1 000 000s GLAST DC-II kick-off, G. Kanbach, Mar 2, 2006
Dependence on max_diff The dependence of the signal width on max_diff Simmulated Pulsar at 10Hz Pulse width ~ 1/max_diff Power RMS off peak is called Noise • Small max_diff • + Small number of differences (fast) • + Coarse stepping in Frequency space (fast) • Large noise (Small S/N ratio) • Large max_diff • + Good S/N ratio • - Large number of differences (very slow) GLAST DC-II kick-off, G. Kanbach, Mar 2, 2006
Blind Search for VELA VELA Viewing Period VP 7 max_diff 10 000s Scan region 1 Hz – 100 Hz F0 trials with S/N > 10 Number of Photons 1 197 Number of differences 22 700 Number F trials 2 000 000 Calculations 52 800 000 000 took 4h 30 min Refined search around good F0 candidates F0 catalog 11.19888756 F0 from search 11.19882249 F1 catalog -0.1557 E-10 F1 from search 0.0850 E-10 GLAST DC-II kick-off, G. Kanbach, Mar 2, 2006
Blind Search for GEMINGA GEMINGA Viewing Period VP 10 max_diff 10 000s Scan region 1 Hz – 100 Hz F0 trials with S/N > 10 Number of Photons 1 200 Number of differences 12 300 Number F trials 2 000 000 Calculations 2 400 000 000 took 3h 30 min Refined search around good F0 candidates F0 catalog 4.2177501 F0 from search 4.2176815 F1 catalog -0.00195 E-10 F1 from search -0.00935 E-10 GLAST DC-II kick-off, G. Kanbach, Mar 2, 2006
F1 GEMINGA -0.00195 E-10 F1 VELA -0.15666 E-10 F1 CRAB -3.86228 E-10 Simulate Pulsar F0 = 10Hz F1 = -3.0 E-10 Scan in F1 CRAB max_diff 10 000s Scan in F1 @ 10 Hz, max_diff 10 000s The large Fdot=F1 of CRAB GLAST DC-II kick-off, G. Kanbach, Mar 2, 2006
F0 catalog 30.2254 F0 from search 29.9493 F1 catalog -3.8623 E-10 F1 from search -3.7719 E-10 Epoch CRAB 40000 Epoch Search 48393 F0 and F1 Scan for CRAB Scan in F CRAB max_diff 10 000s F1 steps @ 10Hz 0.05 E-10 F1 steps @ 30Hz 0.15 E-10 Calculations took 4d 16h GLAST DC-II kick-off, G. Kanbach, Mar 2, 2006
Autocorrelation: on a (visible) photon stream from the Crab using an APD detector(‚OPTIMA‘) and a commercial correlator unit* (D. Dravins et al., Lund University) *correlator.com, 15 Colmart Way, Bridgewater, NJ 08807 GLAST DC-II kick-off, G. Kanbach, Mar 2, 2006
Summary: Folding methods are useful small P-Pdot ranges to refine lightcurves or find periodicity inside an extrapolated ephemeris Fourier power on lightcurves (including harmonics) is an extension of epoch folding with well defined significance levels. Full scale Fourier transformations have been successful to find Geminga in EGRET data: FFT on supercomputer (Mattox et al., 1996) Evolutionary search (Brazier & Kanbach, 1996) Autocorrelation methods could be even more sensitive because phase coherence is less essential GLAST DC-II kick-off, G. Kanbach, Mar 2, 2006
Some References Buccheri, R., et al., A&A, 175, 353 (1987) Buccheri, R., et al., A&A, 128, 245 (1983) De Jager O.C. et al., A&A, 221, 180 (1989) Chandler, A.M. et al., ApJ, 556, 59, (2001) Mattox, J.R., et al., A&A Suppl., 120. 95, (1996) Brazier, K.T.S. & Kanbach, G., A&A Suppl., 120. 85, (1996) GLAST DC-II kick-off, G. Kanbach, Mar 2, 2006