Download
1 / 1
10 likes | 138 Vues
Seasonal, Interannual, and Decadal Scale Freshwater Variability in the Alaska Coastal Current Thomas J. Weingartner 1 , Seth L. Danielson 1 , and Thomas C. Royer 2 1 Institute of Marine Science, University of Alaska, Fairbanks, AK 99709

E N D
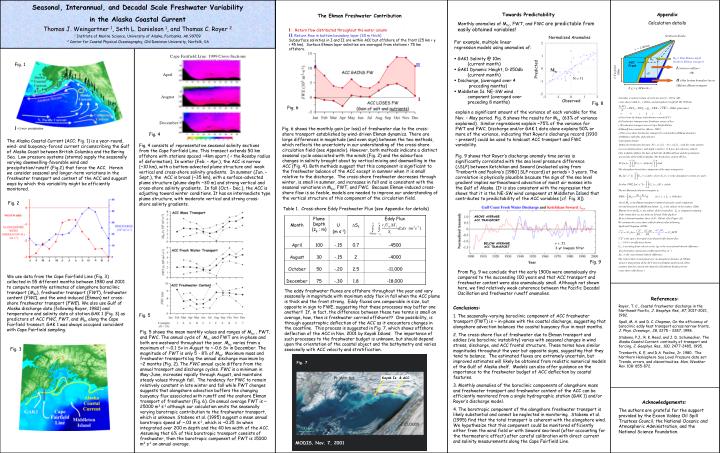
Seasonal, Interannual, and Decadal Scale Freshwater Variability in the Alaska Coastal Current Thomas J. Weingartner 1, Seth L. Danielson 1, and Thomas C. Royer 2 1 Institute of Marine Science, University of Alaska, Fairbanks, AK 99709 2 Center for Coastal Physical Oceanography, Old Dominion University, Norfolk, VA Towards Predictability Monthly anomalies of Mbc, FWT, and FWC are predictable from easily obtained variables! Appendix Calculation details The Ekman Freshwater Contribution I: Return flow distributed throughout the water column II: Return flow in bottom boundary layer (30 m thick) Subsurface salinities inI and II are within ACC but offshore of the front (25 km < y < 45 km). Surface Ekman layer salinities are averaged from stations > 75 km offshore. Southeast Alaska Normalized Anomalies • For example, multiple linear regression models using anomalies of: • GAK1 Salinity @ 10m (current month) • GAK1 Dynamic Height, 0-250db (current month) • Discharge, (averaged over 4 preceding months) • Middleton Is. NE-SW wind component (averaged over preceding 8 months) x = 1500 km DE = 20m Ekman depth Onshore Ekman transport DE ACC Front II Fig. 1 C.Fairfield 180m I(interior outflow) OR II(30m bottom boundary layer) Offshore Ekman transport Predicted Mbc -H N = 31 0 < y < 40 km (Ly ) I Observed Fig. 8 Fig. 6 Other processes explain a significant amount of the variance of each variable for the Nov. – May period. Fig. 8 shows the results for Mbc(63% of variance explained). Similar regressions explain ~75% of the variance for FWT and FWC. Discharge and/or GAK 1 data alone explains 50% or more of the variance, indicating that Royer’s discharge record (1930 – present) could be used to hindcast ACC transport and FWC variability. Fig. 9 shows that Royer’s discharge anomaly time series is significantly correlated with the sea level pressure difference (DSLP) between Ketchikan and Seward (evaluated using from Trenberth and Paolino’s [1980] SLP record) at periods > 3 years. The correlation is physically plausible because the sign of the sea level gradient implies northeastward advection of moist air masses into the Gulf of Alaska. (It is also consistent with the regression that shows that it is the NE-SW wind component at Middleton Island that contributes to predictability of the ACC variables [cf. Fig. 8]). Fig. 6 shows the monthly gain (or loss) of freshwater due to the cross-shore transport established by wind-driven Ekman dynamics. There are large differences in magnitude (and even sign) between the two methods, which reflects the uncertainty in our understanding of the cross-shore circulation field (see Appendix). However, both methods indicate a distinct seasonal cycle associated with the winds (Fig. 2) and the subsurface changes in salinity brought about by vertical mixing and downwelling in the ACC (Fig. 4). Both methods suggest that this component is significant to the freshwater balance of the ACC except in summer when it is small relative to the discharge. The cross-shore freshwater decreases through winter, is small in summer, and increases in fall and is consistent with the seasonal variations in Mbc, FWT, and FWC. Because Ekman-induced cross-shore flow is so feeble, models are needed to improve our understanding of the vertical structure of this component of the circulation field. Fig. 4 The Alaska Coastal Current (ACC; Fig. 1) is a year-round, wind- and buoyancy-forced current circumscribing the Gulf of Alaska Coast between British Columbia and the Bering Sea. Low pressure systems (storms) supply the seasonally varying downwelling-favorable wind and precipitation/runoff (Fig.2) that force the ACC. Herein we consider seasonal and longer-term variations in the freshwater transport and content of the ACC and suggest ways by which this variability might be efficiently monitored. Fig. 4 consists of representative seasonal salinity sections from the Cape Fairfield Line. This transect extends 50 km offshore with stations spaced ~4km apart ( < the Rossby radius of deformation). In winter (Feb. – Apr.), the ACC is narrow (~10 km), with a bottom-advected plume structure and weak vertical and cross-shore salinity gradients. In summer (Jun. – Sept.), the ACC is broad (~35 km), with a surface-advected plume structure (plume depth ~30 m) and strong vertical and cross-shore salinity gradients. In fall (Oct.- Dec.), the ACC is adjusting toward winter conditions. It has an intermediate type plume structure, with moderate vertical and strong cross-shore salinity gradients. Fig. 2 Table 1. Cross-shore Eddy Freshwater Flux (see Appendix for details) ABOVE AVERAGE ACC TRANSPORT BELOW AVERAGE ACC TRANSPORT r = .71 3-yr lowpass filter Fig. 9 From Fig. 9 we conclude that the early 1900s were anomalously dry compared to the succeeding 100 years and that ACC transport and freshwater content were also anomalously small. Although not shown here, we find relatively weak coherence between the Pacific Decadal Oscillation and freshwater runoff anomalies. We use data from the Cape Fairfield Line (Fig. 3) collected in 55 different months between 1980 and 2001 to compute monthly estimates of alongshore baroclinic transport (Mbc), freshwater transport (FWT), freshwater content (FWC), and the wind-induced (Ekman) net cross-shore freshwater transport (FWE). We also use Gulf of Alaska discharge data (following Royer, 1982) and temperature and salinity data at station GAK 1 (Fig. 3) as predictors of ACC FWC, FWT, and Mbcalong the Cape Fairfield transect. GAK 1 was always occupied coincident with Cape Fairfield sampling. The eddy freshwater fluxes are offshore throughout the year and vary seasonally in magnitude with maximum eddy flux in fall when the ACC plume is thick and the front strong. Eddy fluxes are comparable in size, but opposite in sign to FWE, suggesting that these processes may buffer one another!! If, in fact, the difference between these two terms is small on average, how, then is freshwater carried offshore?? One possibility, is through ageostrophic deflection of the ACC as it encounters changes in the coastline. This process is suggested in Fig. 7, which shows offshore deflection of the ACC in Nov. 2001 by Kayak Island. The importance of such processes to the freshwater budget is unknown, but should depend upon the orientation of the coastal object and the bathymetry and varies seasonally with ACC velocity and stratification. References: Royer, T. C., Coastal freshwater discharge in the Northeast Pacific, J. Geophys. Res., 87, 2017-2021, 1982. Spall, M. A. and D. C. Chapman, On the efficiency of baroclinic eddy heat transport across narrow fronts, J. Phys. Oceanogr., 28, 2275 – 2287, 1998. Stabeno, P.J., R. K. Reed, and J. D. Schumacher, The Alaska Coastal Current: continuity of transport and forcing, J. Geophys. Res., 100, 2477-2485, 1995. Trenberth, K. E. and D.A. Paolino, Jr. 1980. The Northern Hemisphere Sea Level Pressure data set: Trends, errors, and discontinuities. Mon. Weather Rev. 108: 855-872. Conclusions: 1. The seasonally-varying baroclinic component of ACC freshwater transport (FWT) is ~ in-phase with the coastal discharge, suggesting that alongshore advection balances the coastal buoyancy flux in most months. 2. The cross-shore flux of freshwater due to Ekman transport and eddies (via baroclinic instability) varies with seasonal changes in wind stress, discharge, and ACC frontal structure. These terms have similar magnitudes throughout the year but opposite signs, suggesting that they tend to balance. The estimated fluxes are extremely uncertain, but improved estimates will likely be obtained from realistic numerical models of the Gulf of Alaska shelf. Models can also offer guidance on the importance to the freshwater budget of ACC deflection by coastal features. 3. Monthly anomalies of the baroclinic components of alongshore mass and freshwater transport and freshwater content of the ACC can be efficiently monitored from a single hydrographic station (GAK 1) and/or Royer’s discharge model. 4. The barotropic component of the alongshore freshwater transport is likely substantial and cannot be neglected in monitoring. Stabeno et al. (1995) find that the total transport is coherent with the alongshore wind. We hypothesize that this component could be monitored efficiently either from the wind field or with Seward sea-level (after accounting for the thermosteric effect) after careful calibration with direct current and salinity measurements along the Cape Fairfield Line. Fig. 5 Fig. 5 shows the mean monthly values and ranges of Mbc , FWT, and FWC. The annual cycle of Mbc and FWT are in-phase and both are westward throughout the year.Mbc varies from a maximum of ~-0.1 Sv in August to ~-0.6 Sv in December. The magnitude of FWT is only 5 - 8% of Mbc. Maximum mass and freshwater transports lag the annual discharge maximum by ~2 months (Fig. 2). The FWC annual cycle differs from the annual transport and discharge cycles. FWC is a minimum in May-June, increases rapidly through August, and maintains steady values through fall. The tendency for FWC to remain relatively constant in late winter and fall while FWT changes suggests that alongshore advection buffers the changing buoyancy flux associated with runoff and the onshore Ekman transport of freshwater (Fig. 6). On annual average FWT is ~ 25000 m3 s-1 although our calculation omits the seasonally varying barotropic contribution to the freshwater transport, which is unknown. Stabeno et al. (1995) suggest a mean annual barotropic speed of ~.03 m s-1, which is ~0.25 Sv when integrated over 200 m depth and the 40 km width of the ACC. Assuming that 6% of this barotropic transport consists of freshwater, then the barotropic component of FWT is 15000 m3 s-1 on annual average. Fig. 3 Fig. 7 Kayak Is. & ACC Acknowledgements: The authors are grateful for the support provided by the Exxon Valdez Oil Spill Trustees Council, the National Oceanic and Atmospheric Administration, and the National Science Foundation. MODIS, Nov. 7, 2001


![Freshwater Variability on the Gulf of Alaska Shelf [ OS42A-01 ]](https://cdn2.slideserve.com/3972677/slide1-dt.jpg)