Download
1 / 22
220 likes | 358 Vues
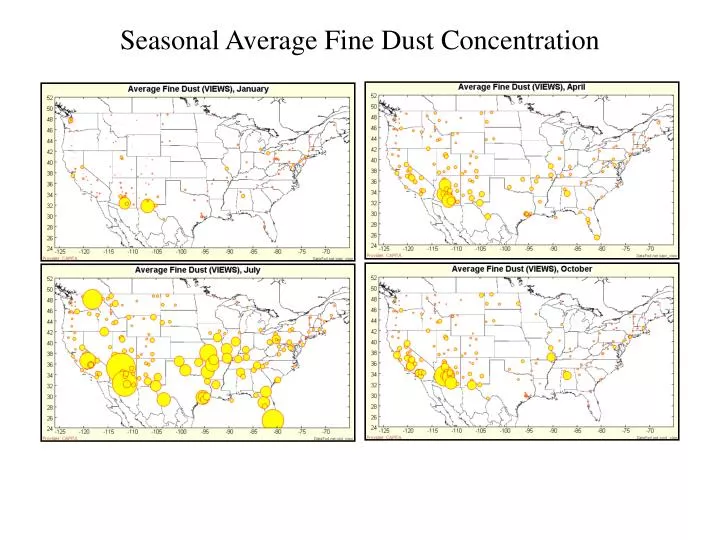
Seasonal Average Fine Dust Concentration. Origin of Fine Dust Events over the US. Gobi dust in spring Sahara in summer. Fine dust events over the US are mainly from intercontinental transport. Daily Average Concentration over the US. Sulfate is seasonal with noise

E N D
Origin of Fine Dust Events over the US Gobi dust in spring Sahara in summer Fine dust events over the US are mainly from intercontinental transport
Daily Average Concentration over the US Sulfate is seasonal with noise Noise is by synoptic weather Dust is seasonal with noise Random short spikes added VIEWS Aerosol Chemistry Database
Annual July Sahara and Local Dust Apportionment: Annual and July The Sahara and Local dust was apportioned based on their respective source profiles. • The maximum annual Sahara dust contribution is about 1 mg.m3 • In Florida, the local and Sahara dust contributions are about equal but at Big Bend, the Sahara contribution is < 25%. • In July the Sahara dust contributions are 4-8 mg.m3 • Throughout the Southeast, the Sahara dust exceeds the local source contributions by w wide margin (factor of 2-4)
Supporting Evidence: Transport Analysis Satellite data (e.g. SeaWiFS) show Sahara Dust reaching Gulf of Mexico and entering the continent. The air masses arrive to Big Bend, TX form the east (July) and from the west (April)
Seasonal Fine Aerosol Composition, E. US Smoky Mtn Upper Buffalo Everglades, FL Big Bend, TX
July 5, 1992 Sahara PM10 Events over Eastern US Much previous work by Prospero, Cahill, Malm, Scanning the AIRS PM10 and IMPROVE chemical databases several regional-scale PM10 episodes over the Gulf Coast (> 80 ug/m3) that can be attributed to Sahara. The highest July, Eastern US, 90th percentile PM10 occurs over the Gulf Coast ( > 80 ug/m3) Sahara dust is the dominant contributor to peak July PM10 levels. June 30, 1993 June 21 1997
FASTNET Event Report: 040219TexMexDust Texas-Mexico Dust Event February 19, 2004 Contributed by the FASNET Community Correspondence to R Poirot, R Husar MODIS Rapid Response
Satellites detect dust most storms in near real time The MODIS sensor on AQUA and Terra provides 250m resolution images of the dust storm Visual inspection reveals the dust sources at the beginning of dust streaks. The NOAA AVHRR sensor highlights the dust by its IR sensors In the TOMS satellite image, the dust signal is conspicuously absent – too close to the ground
Surface met data from the 1200 station network documents the strong winds that cause the windblown dust and resulting low-visibility regions
High Wind Speed – Dust Spatially Correspond The spatial/temporal correspondence suggests that most visibility loss is due to locally suspended dust, rather than transported dust Alternatively, suspended dust and ‘high winds’ travel forward at the same speed Wind speed animation; Bext animation. (material for model validation?)
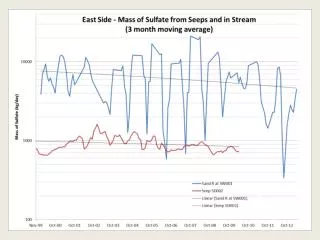
PM10 > 10 x PM25During the passage of the dust cloud over El Paso, the PM10 concentration was more than 10 times higher than the PM2.5 AIRNOW PM10 and Pm25 data Schematic Link to dust modelers for faster collective learning?
Monte Carlo simulation of dust transport using surface winds (just a toy, 3D winds are essential!) See animation Note, how sensitive the transport direction is to the source location (according to this toy)
VIEWS Fine Mass, Sulfate, OC, Dust, 02-07-01 Mass SO4 OC OC Dust
NCore Integration NOAA/NASA Satellite: Global/Continental transport Other Networks: Deposition, Ecosystems Intensive/diagnostic Field Programs Longer Term Goal: Integrated Observation-modeling Complex Similar to Meteorological Models (FDDA) Model Adjustments Through Obs. All in Near Real Time Full Model Dims (x, y, z, t, chemistry, size)
FastAerosolSensingToolsfor Natural EventTrackingFASTNET Support by Inter-RPO WG - NESCAUM Performed by CAPITA & Sonoma Technology, Inc Project Synopsis Haze levels should be reduced to the ‘natural conditions’ by 2064. The space, time, composition features of natural aerosols are not known This long-term project goal is to better characterize the natural haze conditions Focus is on detailed analysis of major natural events, e.g. forest fires and windblown dust FASTNET is primarily a tools development project for data access, archiving and analysis This, first year pilot project focuses on demonstrating the feasibility and utility of approach