Download
1 / 12
140 likes | 369 Vues
Osmosis in Potatoes. IB Biology Topic 2 Internal Assessment. Internal Assessment Timetable. Tuesday 18 th Sept: -pre-lab -carrying out a standardised practical using handouts I will give you

E N D
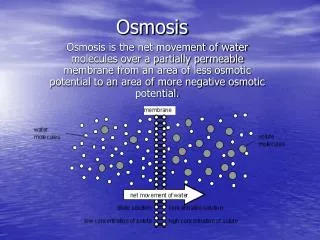
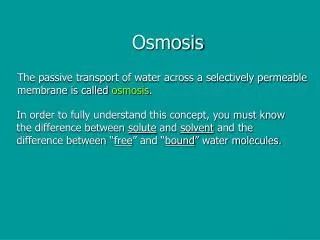
Osmosis in Potatoes IB Biology Topic 2 Internal Assessment
Internal Assessment Timetable • Tuesday 18th Sept: -pre-lab -carrying out a standardised practical using handouts I will give you -familiarising yourself with working in a lab and thinking about how you could adapt the experiment for an Internal Assessment • Friday 21st Sept: -Using your Design Lab Training Sheet you will work in teams to design a practical investigating an aspect of osmosis. -all pupils will write up a design INDIVIDUALLY (to be completed for homework) • Monday 24th Sept: -You will carry out the practical and collect data as a team -no completed Design booklet = no data collection for your team and an automatic fail -you MUST organise your data tables onto an excel spreadsheet and bring them to class the following day • Tuesday 25th Sept: -I will show you how to process your data with statistics -specifically using Excel to calculate means, standard deviations and draw graphs -your homework will be to write up your design and your raw data FORMALLY for the following Tuesday • Monday 1stOctober: -we will continue processing data • Tuesday 2nd October: -I will guide you on how to write up a conclusion and evaluation -you will complete the write up for homework • Tuesday 9th October -you will bring your COMPLETED IA to class printed out in its proper format
Pre-lab 3 cm
Writing A Statement of the Problem for the Experiment What should it state? It should state: “The Effect of the IndependentVariable on the DependentVariable”. A good statement of the problem for “Rate of photosynthesis” would be The effect of light intensity on the rate of photosynthesis
More about our variables: The independent variable is the variable that is purposely changed. It is the manipulated variable. The dependent variable changes in response to the independent variable. It is the responding variable. What is the “photosynthesis” independent variable? Light intensity measured in Lux What is the dependent variable? Volume of O2 produced per minute
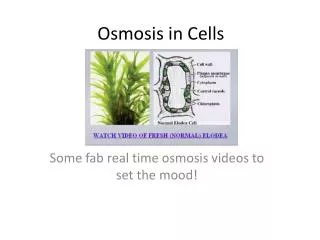
Title for the photosynthesis experiment The effect of light intensity on the rate of photosynthesis of Elodea
Another Look at Our Hypothesis INDEPENDENT VARIABLE If the light intensity increases, DEPENDENT VARIABLE then the rate of photosynthesis will increase. To make this IB worthy you MUST: a)Include a sketch graph of your predicted results b) Give SCIENTIFIC reasoning as to why you predict this
Controls in an Experiment Factors that are kept the same and not allowed to change What should be kept constant in the experiment? CONSTANTS Type of plant C02 concentration Time the experiment runs for Time intervals at which the DV is measured Wattage of light bulb Colour of bulb Temperature of experiment Time of day
Values of the Independent Variable How many different values of the independent variable should we test? Enough to clearly illustrate a trend in the data –always use the 5x5 rule for continuous data e.g. 10cm, 20cm, 30cm, 40cm, 50cm
Repeated Trials How many repeated trials are needed in the experiment At least 5, then calculate n mean value for each level of the independent variable (this will also give enough data to calculate standard deviation)