Download
1 / 12
120 likes | 141 Vues
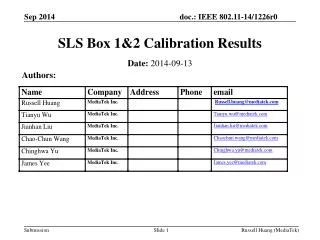
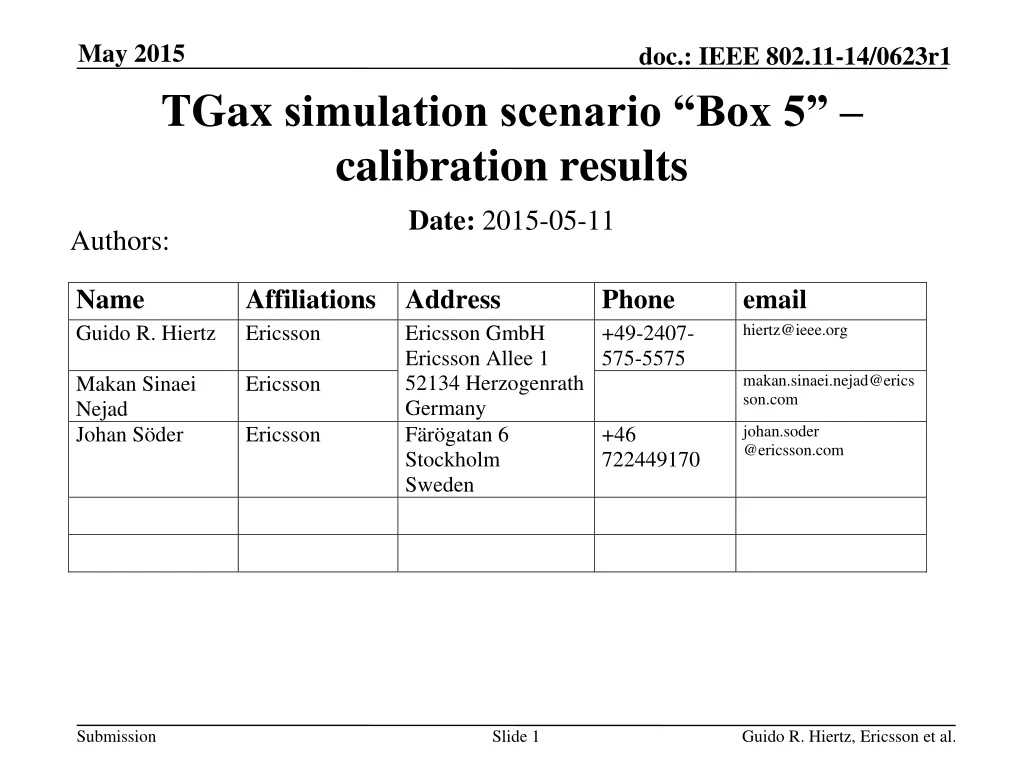
TGax simulation scenario “Box 5” – calibration results. Authors:. Date: 2015-05-11. Abstract.

E N D
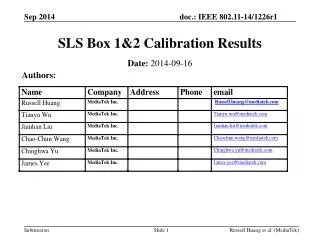
TGax simulation scenario “Box 5” – calibration results Authors: • Date:2015-05-11 Guido R. Hiertz, Ericsson et al.
Abstract • This submission presents our results of the TGax“Box 5” [1] simulation tool calibration test. We follow [2] and simulate scenario 6 (“Enterprise Network with OBSS”) of [3]. As with previous studies [4] the results reveal that our simulation tool behaves equal to other tools. Guido R. Hiertz, Ericsson et al.
Standalone operation of BSS B – Downlink traffic per STA in Mb/s Guido R. Hiertz, Ericsson et al.
Standalone operation of BSS B – Uplink traffic per STA in Mb/s Guido R. Hiertz, Ericsson et al.
Guido R. Hiertz, Ericsson et al. Simultaneous operation of all three BSSs – Downlink only traffic results • Throughput (Mb/s): • BSS A: 84.3 • BSS B: 122.7 • BSS C: 104.6 • Total: 311.6 • BSS A (STAs 1, 2, 4, 5, 7, 8, 10, 11, 13, 14, 16, 17, 19, 20, 25, 26, 28, 29) • BSS B (STAs 3, 9 ,15, 27) • BSS C (STAs 6, 12,18, 30)
Simultaneous operation of all three BSSs – Downlink only traffic results comparison Guido R. Hiertz, Ericsson et al.
Guido R. Hiertz, Ericsson et al. Simultaneous operation of all three BSSs – Uplink only traffic results • Throughput (Mb/s): • BSS A: 80.9 • BSS B: 120.4 • BSS C: 137.8 • Total: 339.1 • BSS A (STAs 1, 2, 4, 5, 7, 8, 10, 11, 13, 14, 16, 17, 19, 20, 25, 26, 28, 29) • BSS B (STAs 3, 9 ,15, 27) • BSS C (STAs 6, 12,18, 30)
Simultaneous operation of all three BSSs – Uplink only traffic results comparison Guido R. Hiertz, Ericsson et al.
Guido R. Hiertz, Ericsson et al. Simultaneous up- & downlink operation of all three BSSs – Throughput in Mb/s • BSS A: 51.9 • DL: 2.0, UL: 49.9 • BSS C: 151.5 • DL: 28.3,UL: 123.2 • Total: 349.5 • DL: 70.7,UL: 278.8 • BSS B: 146.1 • DL: 40.4, UL: 105.7
Simultaneous up- & downlink operation of all three BSSs – Comparison Guido R. Hiertz, Ericsson et al.
Guido R. Hiertz, Ericsson et al. Observations • Simulation results similar to other submissions • Little distance variation leads to limited pathloss variation in BSS B • Right table shows SNR in UL direction per STA • 5 dB higher SNR in DL because of higher output power of AP • Fixed Modulation and Coding Scheme selection as required by “Box 5” test results in equal throughput distribution in BSS A
References • R. Porat et al., “11ax Evaluation Methodology,” 11-14/0571r8 • J. Pang et al., “Discussion about Box5 Calibration,” 11-14/1177r2 • P. Loc et al., “TGac Functional Requirements and Evaluation Methodology,” 11-09/00451r16 • Y. Li, “MAC calibration results comparison,” 11-14/1192r6 • S. Merlin et al., “TGax Simulation Scenarios,” 11-14/0980r10 Guido R. Hiertz, Ericsson et al.