Download
1 / 74
740 likes | 745 Vues
BUSINESS PLANNING AND COMMERCIAL EFFICIENCY PROGRAM. A TOOL TO ACHIEVE IMPROVED PERFORMANCE AND FINANCIAL SUSTAINABILITY. Business Planning Training Program. Module 8 Organization Structure and Staffing Levels. Organizational Structure and Staffing Level.

E N D
BUSINESS PLANNING AND COMMERCIAL EFFICIENCY PROGRAM A TOOL TO ACHIEVE IMPROVED PERFORMANCE AND FINANCIAL SUSTAINABILITY
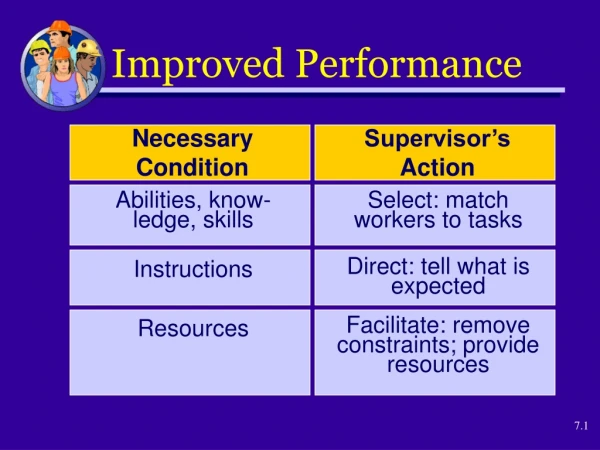
Organizational Structure and Staffing Level • Staffing structure and staff empowerment drives success • Organizational principles must be understood and put into practice • Historical structures may not fit tomorrow’s challenges
Job Specialization Span of Control Chain of Command DelegationofResponsibility Delegation of Authority Principles of Organization Line Authority Principles of Organization Staff Authority
Unity of Command • Represents line of authority through the organization: • A subordinate should have one and only one superior to whom he or she is directly responsible.
Span of Control • Number of subordinates to a supervisor • Inefficient to have 1 to 1 • Inefficient to have 10 to 1 • Factors to consider: • Capabilities of manager • Capabilities of subordinate • Similarities of work activities supervised • External pressure on manager • External help available to manager
Delegation of Authority and Responsibility • Effective utilities actively and aggressively delegate responsibility and authority. • Both delegations must be done in parallel: Responsibility without authority will frustrate staff and lead to failure. • Delegation takes place within Chain of Command.
Work Specialization and Cross-training • Water and wastewater job is technically complex and requires special skills. • Specialization should not create inefficiency of staffing, especially in small utilities. • Cross-training will improve staff competencies and diversity of work routine.
Line and Staff Authority Mission Support the Mission Staff Authority Execute the Mission Line Authority
Supply Metering Line Authority Commercial Treatment Distribution Line Authority
Public Relations Legal Engineering Staff Authority Personnel Accounting Staff Authority
Current Structure and Lines Of Reporting • Prepare graphic representation of current organizational structure. • Clarify the Chain of Command – who reports to whom? • Note the Span of Control for each person in a supervisory position. • Using two colors, reflect which positions are line and which positions are staff.
Structure of Water Boards in Cyprus Technical Administration Internal Audit Financial Services Services Ex-officio members • Chairman • Accountant General • Director WDD Other members • From local government Board Manager
Optimal Staffing Level • Staffing level is affected by technology, automation, skill level, geographic size • Common performance indicator is number of staff per 1000 water/sewer connections • Well performing utilities • Water only = 2.5 to 4.0 • Water and Sewer = 3.5 to 5.0
Changing and Transitioning Staffing Level • Consider functional areas currently under staffed • Consider functions that are not specifically defined in the organization • Consider cost centers and functional areas such as bulk services and retail services • Consider a transition strategy if down-sizing is necessary
Documenting Recent Financial Performance • Gather financial information for at last the past three years • Evaluating expenditure trends • Identify factors influencing future expenses • Sincerely evaluate operational and maintenance expenses
O&M Cost Categories • Salaries • Personnel Costs • Consumable Expenditures
Itemizing O&M Cost Categories Salaries • Annual Base Salary • Overtime • 13-th Month Paycheck • Bonuses • Other Compensations • Board of Directors Compensation Personnel Costs • Social Security • Employee Compensation • Training
Itemizing O&M Cost Categories Consumable Expenditures • Maintenance • Materials • Electrical Energy • Security Services • Other Contracted Services • Office and Administrative • Transport • Confidential and Intelligence • Taxes • Purchased Water • Public Relations Campaign • Other Expenditures
Capital Expenditure • Capital Renewal • Underground or Buries Assets • Capital Repair and Replacement • Above Fixed and Moveable Assets • New Capital Investments • Add New Technology • Expand Systems or Increase Coverage
Underground Assets • Capital Renewals Expense • Buried Pipelines and Networks • Indeterminate Useful Life • Hidden Conditions • Difficult to Apply Depreciation Rates • Budget on Annual Expense Base
Above Ground Assets • Capital Repair/Replacement Fund • Operating Equipment and Structures • Actual Conditions • Technical Innovations • Consider Depreciation Rates • Determine Average Contribution • Used as the Needs Dictate
Asset Management You cannot manage what you do not know! Estimate expected year of replacement! Forecast potential future capital expenditure! • Know your assets! • Know their technical condition! • Know their replacement cost! Asset Inventory Reconstruction Planning • Realistic asset value • Base for planning • Connects MIR and accountancy • What…? • When…? • How… ? • From what resource?
Asset Management ASSET INVENTORY • Built on the best quality data available! (map records, GIS…) • Object-based • Structured • Integrated • Regularly updated
Mrd Ft Replacement Cost 2015 c Amortization-1 Asset Value 2015 c Current book value Amortization-2 Amortization-0 c 2015 Expected Year of Replacement Years Development of Asset Book Value Value at Acquisition
Methods of Asset Evaluation Book value of water utility assets: • does not reflect to the real value of utilities • does not generate the necessary funds for reconstruction Market value: • regulated pricing of water utility services • no market value, not applicable method Depreciated Replacement Cost (DRC) Method • state/municipality ownership of water utilities • non-marketable assets • required by regulations and professional standards (TEGoVa, EVS)
Reconstruction of Existing Systems International Outlook Proportion of reconstruction funds in water/wastewater tariffs:(amortization of utility assets/revenue from tariffs): • Hungary: <11% • Germany: 45% • Switzerland: 69% Reconstruction ratio of networks and calculated period of full renewal (network reconstruction/lenght of network/year): • Switzerland: 1.9-1.0% 50-100 years • Germany: 1.0% 100 years • Hungary: 0.4-0.2% 250-500 years
New Capital Investment Fund • New Technology or Services Level • 24-hour Pressurized Water • Higher Treatment Standards • More Water Available • Improve Performance • Increase Service Coverage • New Connection • Increases Customer Base • Higher Water Production
Capital Investment Plan and Sources • Capital Investment Plan Forecast • Performance Improvement Program • Capital Expenses/Reserve Fund Needs • Timing Contributions/Expenditures • Identifying Sources of CapitalInvestment • Capital Reserve Funds • Different Local Grants or Credits • Credits or Grants from Donors or IFI’s • Credits from Commercial Banks
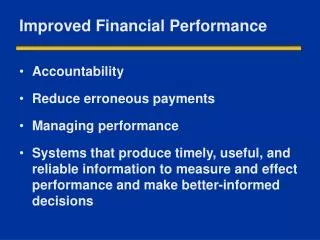
Performance Improvement Program • Establishing the imperative for change and performance improvement. • Moving from Strategic Goals to Performance Improvement through an Action Plan. • Measuring performance to document success against the defined standard of performance.
Performance Gap • Where is the Utility today? • Where does the Utility want to be tomorrow? • How does the Utility begin to close the Performance Gap?