Download
1 / 25
250 likes | 399 Vues
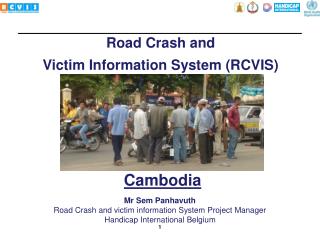
Road Crash and Victim Information System (RCVIS). Cambodia. Mr Sem Panhavuth Road Crash and victim information System Project Manager Handicap International Belgium. Content. Data analysis Report writing Report dissemination. 1. Data analysis.

E N D
Road Crash and Victim Information System (RCVIS) Cambodia Mr Sem Panhavuth Road Crash and victim information System Project Manager Handicap International Belgium 1
Content • Data analysis • Report writing • Report dissemination 2
1. Data analysis • Given the recommendation for policy change • Identification of countermeasures for specific action. • The evaluation of road crash and fatality from month to month or year to year. • Evaluate the trend of fatality rate, helmet rate, head injury, blackspot treatment…etc • Determine any improvements that could be made in future phases 3
1. Data analysis SPSS (Statistical Package for the Social Science) Software? SPSS for Windows provides a powerful statistical-analysis and data-management system in a graphical environment, using descriptive menus and simple dialog boxes to do most of the work for you. Most tasks can be accomplished simply by pointing and clicking the mouse. 4
1. Data analysis SPSS (Statistical Package for the Social Science) Software? SPSS for Windows provides a powerful statistical-analysis and data-management system in a graphical environment, using descriptive menus and simple dialog boxes to do most of the work for you. Most tasks can be accomplished simply by pointing and clicking the mouse. 5
1. Data analysis • Open SPSS: • Start All program SPSS for window SPSS 15.0 for Windows Evaluation • Open data from MS Access • Click FileOpen DatabaseNew Query • In ODBC data source box, Select MS Access Database then click Next • Click on browse button to find the location of database • Select database you want click Open click OK. • Select any view base on your condition then drag and drop on Retrieve Fields in This Order box click OK 6
1. Data analysis • 3. Give value of each field: • Click on Variable View Tab Click on Value Column 11
1. Data analysis • 3. Give value of each field: • Give value in Value text box Type label in Label box Click OK • In Measure column Change Scale to Nominal for variable have Type as Numeric 12
1. Data analysis • 4. Recode of data: • Converting data is very important in data analysis it means that sometimes we need different data. • The data can be converted from Quantitative to Qualitative or Qualitative to Qualitative. • Recode of data is a creation of new variable. 13
1. Data analysis • 4. Recode of data: • Click Transform Menu Recode into Different Variables • Select variable you want to recode Click on • Type new name in Name text box and then type Label in Label box Click on Change button • Click on Old and New Values button to group old value to new value: • Range lowest value: on old value frame, select Rang, lowest through value option fill in value you want • filling new value in new value frame Click Add • Range highest value: on old value frame, select Rang, highest through value option fill in value you want • filling new value in new value frame Click Add 14
1. Data analysis • 4. Recode of data: • Range value: on old value frame, select Rang option fill in value you want filling new value in new value frame Click Add • Click Continue Click OK to finish recode data. • Give value to new variable as practice in step 3. 15
1. Data analysis • 4. Recode of data: 16
1. Data analysis • 4. Recode of data: 17
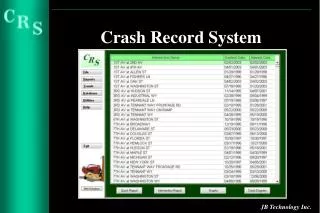
1. Data analysis 5. Output of data: File New Output, to show output window. Analyze Descriptive Statistics Frequency select variable that you want to analyze. Insert Interactive 2-D Graph, to create a graph, click on Assign Graph Variable window appear select variable that you want to analyze. 18
1. Data analysis 5. Output of data: 19
2. Report writing • Compare the evolution or trend from month to month, or year to yea • Unusual changes/number can be noticed, and reviewed again in the database or try to find out the cause of the change • provides critical issues related to the current situation • Summarize the main cause and interesting information • Monthly report format: • Coverage • Introduction • Location of crash fatal • Executive summary • Evaluation of main indicator • Contact 20
2. Report writing • Annual report format: • Cover page • List of figures and foreword • Introduction • Executive summary • Key figures • Recommendation • Data source • Evaluation of data • Data analysis during the year • Regional and national comparisons • Victim information • Crash information • Vehicle involved information • Next step • Appendix • Contact 21
3. Report dissemination • Important of report dissemination: • Monthly and annual reports showing clearly the magnitude and nature of road crash issue • Increase the knowledge to the people on road crash issue. • Showing the effort in implementing the road safety • Increase the commitment from the government • The main source for road safety implementer • Funding for road safety 22
3. Report dissemination • Media: • play an important role in distributing the information to society • Alert the road user to prevent themselves from road crash • increase the political commitment of the government to call more action to reduce the crash. • Government: • Use the report for planning targeted programs • Develop, monitoring, updating action plan, strategies, policy making • Legislative development (helmet laws, drink driving, speeding and etc) • Education campaign • Use data to evaluate the road safety situation • Using the black spot data to plan appropriate remedial actions at dangerous locations along national road network 23
3. Report dissemination • NGO and private company: • Take action to promote road safety through activities awareness • Coordination meeting to update information, identify overlap activities, share information, and increase more action. • Develop road safety policy in their organization • Outsider: • Highly appreciated the quality of the report • Integration of two data sources provides precise and comprehensive information • Modelling system in developing country • Funding to Cambodia to implement road safety program • Good reputation of HIB at international level 24
THANK YOU 25