Download
1 / 36
360 likes | 499 Vues
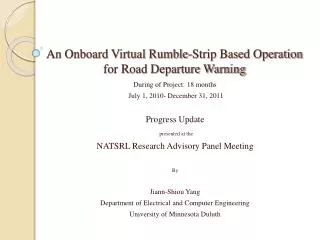
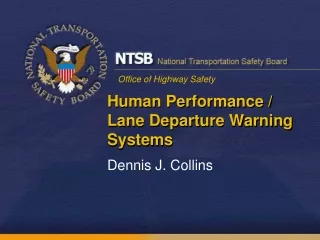
Performance and Capability of a Road Departure Crash Warning System. Bruce Wilson, Ph.D. and Jonathan Koopmann Advanced Vehicle Safety Technology Division Volpe National Transportation Systems Center Cambridge, MA. The Problem.

E N D
Performance and Capability of a Road Departure Crash Warning System Bruce Wilson, Ph.D. and Jonathan Koopmann Advanced Vehicle Safety Technology Division Volpe National Transportation Systems Center Cambridge, MA
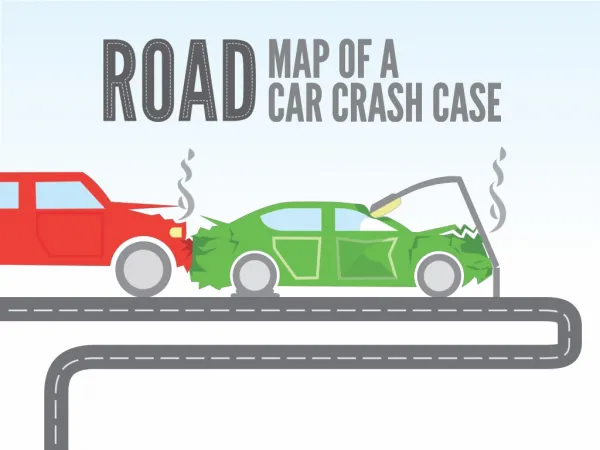
The Problem • 1,200,000 annual Road-Departure Crashes in US = 3,300 per day = 137 per hour • Severe collisions - collide with fixed objects or rollover • 19 percent of collisions, 43 percent of fatalities • Field Operational Test (FOT) of a Road Departure Crash Warning System (RDCW) • Subjects - 78 Participants • Male, female • Younger (20-30), Middle-aged (40-50), Older (60-70) Step Towards Solution
Road Departure Crash Warning System (Device) • Two subsystems • Lateral-Drift Warning (LDW) • Curve-Speed Warning (CSW) • LDW monitors: • lane position, lateral speed • Available Maneuvering Room (AMR) • alerts when vehicle likely to depart lane or road • CSW monitors: • speed, upcoming curvature • alerts when vehicle approaching upcoming curve too fast
RDCW Characterization: Method • Independent Measurement System (NIST-developed, “ground truth”) • 1,300 km of public road driving • Series of maneuvers • Analyzed: • Availability • Measurement accuracy • Alert timing • False positives, false negatives • Survey responses
System Availability and Accuracy • Availability – RDCW able to issue an alert • Accuracy – how accurately RDCW estimates lateral speed, road edge, lane markings, solid objects • “Ground truth” – independent measurement system (IMS) provided second set of reference measurements
Test Measurement Overview • Characterization test data collected on public roads • RDCW sensors supplemented with NIST-developed Independent Measurement System (IMS) • four cameras, differential GPS • Key performance measures • Available maneuvering room, Time to collision • LDW alert need and timing, Time to curvature point of interest • Required deceleration, CSW alert timing and need
Lateral Drift Alerts • For shoulders less than 1 meter wide, the RDCW overestimated the width by 0.7 meters • For shoulders more than 2 meters wide, the RDCW underestimated the width by 1.3 meters • RDCW shoulder-width estimation errors contributed to: • 1 in 8 false-negative alerts (alert needed but not issued) • 1 in 3 false-positive alerts (alert issued but not needed) • The RDCW had the highest percentage of true-positive alerts when the shoulder was 1 to 2 meters wide
Lateral Drift Sensitivity Testing with Wide Shoulders (> 2 m) • Higher sensitivity resulted in earlier alerts (higher TTC) • Wide shoulders and under-estimates of AMR resulted in large TTCs for alerts
LDW Alert Issuance and Validity Alert needed Alert issued
TTC when Crossing Dashed Boundary, datum 1 m outside boundary Alert typically issued 0.4 m after crossing dashed boundary
TTC when Drifting Toward Jersey Barrier or Traffic Barrel Occasional incorrect radar readings caused inconsistent alert timing
LDW Video Analysis and Survey Responses • 3,800 alerts analyzed using video and numerical data • 62 percent were true positive • In dry weather 70 percent of the alerts were true positive; decreasing to 39 percent in rainy weather • On wet surfaces 44 percent of the alerts were true positive • On a scale of 1 to 7, participants rated the LDW alert timing favorably – above 5
LDW Alert Classification by Atmosphere and Road Surface Rain and wet roads caused disproportionate number of false alerts
LDW Alert Classification by Pavement Marking Atypical pavement markings, e.g., lane merge, caused disproportionate number of false alerts
Survey Responses to LDW Alert Timing • Overall, I thought the LDW auditory warnings were provided at the right time (not presented too early or too late). • Overall, I thought the LDW seat vibration warnings were provided at the right time (not presented too early or too late).
Survey Responses to LDW Alert Need • The LDW always provided a warning when I thought it should. • I did not receive any unnecessary LDW warnings. • I did not receive any false LDW warnings
Curve Speed Alerts • 1 of 5 alerts missed for curves with a radius less than 100 meters • 2 of 5 alerts missed for curves with a radius greater than 100 meters • Of the alerts issued on curves whose radius was less than 100 meters, 94 percent were on time, neither too early nor too late • On a scale of 1 to 7, participants rated the CSW alert timing favorably; at 5
Alert Timing by Sensitivity Setting Higher speeds and higher sensitivity settings resulted in earlier alerts
CSW Alert Issuance and Validity by Curve Radius Alert needed Alert issued
Alert Issuance near Exit Ramps • Turn signal resulted in most likely path (MLP) switching to exit ramp • With turn signal, ¾ ramp passes had alert • Without signal, 10/11 ramp passes did not have alert
Survey Responses to CSW Alert Timing • Overall, I thought the CSW auditory warnings were provided at the right time (not too early or too late). • Overall, I thought the CSW seat vibration warnings were provided at the right time (not too early or too late).
RDCW Characterization: Survey Responses, Timing LDW ratings slightly higher than CSW
DVI Readability Participants approved of DVI visual elements, graphics, and performance
Warning Audibility Alert volume and directionality convey warning information to drivers
Summary of LDW FOT Performance • 1 of 3 alerts issued was a false positive, AMR frequently underestimated • Odds of nighttime alert being a false positive are 1.8 odds for daytime alert • Odds of rain alert being a false positive are 3.6 odds for driving under dry conditions • Half the alerts issued in construction zones were false positive • Despite this – participants rated LDW quite favorably
Summary of CSW Characterization Test Performance • Inaccurate estimates of the distance to the curve, the curve radius, or both compromised performance • For typical curves, system failed to alert in 1 of 4 cases of excessive speed • Map errors created some false curves and false alerts • System performed well near ramps
Summary of Survey Data • High ratings for: LDW and CSW alert timing, LDW and CSW missed alerts, LDW false positive performance • Lower ratings for CSW false positive performance • Participants recognized LDW limitations under poor lighting, rain, and wet roads • 7 of 8 participants found it easy to interpret seat vibration alerts • 4 of 5 found LDW audible alerts easy to interpret • 6 of 7 found visual alerts easy to interpret