Download
1 / 28
280 likes | 491 Vues
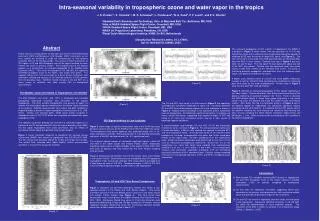
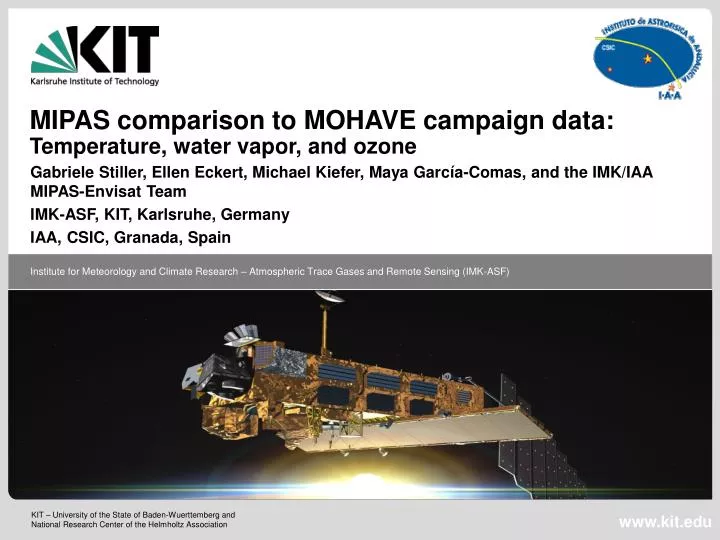
MIPAS comparison to MOHAVE campaign data: Temperature, water vapor, and ozone. Gabriele Stiller, Ellen Eckert, Michael Kiefer, Maya Garc í a-Comas, and the IMK/IAA MIPAS-Envisat Team IMK-ASF, KIT, Karlsruhe, Germany IAA, CSIC, Granada, Spain. MIPAS measurement principle.

E N D
MIPAS comparison to MOHAVE campaign data: Temperature, water vapor, and ozone Gabriele Stiller, Ellen Eckert, Michael Kiefer, Maya García-Comas, and the IMK/IAA MIPAS-Envisat Team IMK-ASF, KIT, Karlsruhe, Germany IAA, CSIC, Granada, Spain
MIPAS measurement principle • IR limb emission spectrometer • Measures day and night • Altitude range 6 to 70 km (NOM); • 18-100 km (MA); 40-170 km (UA) • Pole-to-pole, > 1000 profiles/day • So far 30 trace species, • temperature and cloud • composition • 2002 – 2004: full spectral res., • vertical resolution 3.5 - 6 km • Since 2005: reduced spectral • resolution, vertical resolution • improved (2 - … km) • Scientific analysis of MIPAS data • at IMK/IAA • Please click on to add your Title MOHAVE-2009 Workshop # 2, 18-21 October 2010, University of Bern / IAP, Bern, Switzerland
Data characteristics for T, H2O, and O3 Temperature Vertical resolution: 3.4 km @ 10 km to 1.9 km @ 40 km Horizontal resolution: 250km @ 10km to 400km @ 40 km Vertical resolution: 2.3km @ 20km to 4.1 km @ 40km Horizontal resolution: 200km @ 10km to 440km @ 40 km H2O Ozone Vertical resolution: 2.4km @ 20km to 3.5km @ 50km Horizontal resolution: 250km @ 10km to 400km @ 40 km Von Clarmann et al., AMT, 2009 MOHAVE-2009 Workshop # 2, 18-21 October 2010, University of Bern / IAP, Bern, Switzerland
Method of comparison • Look for coincidences for each MIPAS profile within 1000 km and 4 h. • Build averages of profiles and differences. • If appropriate, convolve with averaging kernel of MIPAS to account for different vertical resolutions. • Presented in this talk: only closest coincidences per profile, in space or in time, and averages from the closest coincidences (comparison to and averages of all coincident profiles available as well). • No separation of day and night profiles for this talk (comparison for day and night profiles, respectively, available as well). • For instruments providing results for various integration intervals (LIDAR_TMF, STROZ, MIAWARA) we have usually used the nightly mean (all night) profiles (comparison to others available as well). • In all figures: Differences are MIPAS – correlative measurement; red curve = MIPAS, red error bars = MIPAS precision, green line = original correlative measurement, black line = correlative measurement convolved with MIPAS AVK, grey area = combined error bars (precision) MOHAVE-2009 Workshop # 2, 18-21 October 2010, University of Bern / IAP, Bern, Switzerland
Temperature MOHAVE-2009 Workshop # 2, 18-21 October 2010, University of Bern / IAP, Bern, Switzerland
Difference MIPAS – ECMWF for one day during MOHAVE-2009 campaign 20-40N/S: Low bias (< 3K) around 18 km, high bias (<2K) below 20S-20N: Lower than ECMWF around 15 km (<3K) MOHAVE-2009 Workshop # 2, 18-21 October 2010, University of Bern / IAP, Bern, Switzerland
-1 K Temperature – Comparison to satellite data ACE AIRS MOHAVE-2009 Workshop # 2, 18-21 October 2010, University of Bern / IAP, Bern, Switzerland
Temperature – comparison to LIDARS ALVICE LIDAR-STROZ MOHAVE-2009 Workshop # 2, 18-21 October 2010, University of Bern / IAP, Bern, Switzerland
Temperature – comparison to LIDARS LIDAR-TMF ALVICE LIDAR-STROZ MOHAVE-2009 Workshop # 2, 18-21 October 2010, University of Bern / IAP, Bern, Switzerland
-1 K Temperature – comparison to LIDARS LIDAR-TMF ALVICE TMF nightly means LIDAR-STROZ TMF-ECMWF MOHAVE-2009 Workshop # 2, 18-21 October 2010, University of Bern / IAP, Bern, Switzerland
Temperature – comparison to frostpoint hygrometers CFH_JPL 3.10 CFH_JPL 3.20 FPH_NOAA MOHAVE-2009 Workshop # 2, 18-21 October 2010, University of Bern / IAP, Bern, Switzerland
Temperature – comparison to sonde data RS92-JPL RS92-JPL RS92-GSFC MOHAVE-2009 Workshop # 2, 18-21 October 2010, University of Bern / IAP, Bern, Switzerland
RS92-GSFC Temperature – comparison to sonde data RS92-JPL RS92-JPL Summary temperature comparsion: RS92-JPL • MIPAS temperatures are mostly within 1-1.5K compared to campaign instruments. • Comparison to AIRS and LIDAR-TMP hints towards an overall stratospheric low bias of MIPAS in the order of 1K. • Low bias of <2K around 18km confirmed. • Most instruments point towards a high bias of MIPAS below tropopause (1-2 K). RS92-GSFC MOHAVE-2009 Workshop # 2, 18-21 October 2010, University of Bern / IAP, Bern, Switzerland
Water vapor MOHAVE-2009 Workshop # 2, 18-21 October 2010, University of Bern / IAP, Bern, Switzerland
TMF all night CFH 3.20 STROZ all night Examples for water vapor comparison FPH_NOAA MOHAVE-2009 Workshop # 2, 18-21 October 2010, University of Bern / IAP, Bern, Switzerland
Examples for water vapor comparison ctnd. ACE AIRS MkIV MIAWARA 24 h MOHAVE-2009 Workshop # 2, 18-21 October 2010, University of Bern / IAP, Bern, Switzerland
FPH_NOAA FPH_NOAA CFH 3.20 AIRS STROZ all night TMF all night Overview average differences water vapor ACE WVMS ACE MkIV MIAWARA 24 h +0.6ppmv +0.3ppmv +0.5ppmv HP MOHAVE-2009 Workshop # 2, 18-21 October 2010, University of Bern / IAP, Bern, Switzerland
Water vapor – comparison to sonde data and ALVICE RS92_JPL ALVICE v1.1 RS92_GSFC Have we done something wrong with the RS92 and ALVICE data? MOHAVE-2009 Workshop # 2, 18-21 October 2010, University of Bern / IAP, Bern, Switzerland
Summary comparison water vapor • Due to non-LTE effects a comparison is meaningful below 50 km only; above 50 km, MIPAS has a well-known low bias of ≥ 1 ppmv. • The deviations are mostly well within the combined errors. But: • All stratospheric instruments hint towards a high bias of MIPAS around 45 km in the order of 0.3 to 0.6 ppmv (however within combined error except for WVMS). This might be a compensation for the low bias above, or due to temperature bias. • Immediately below the hygropause, MIPAS seems to be too high by about 0.2 to 0.6 ppmv (but mostly within combined error), possibly due to the temperature bias. • Farther below, differences between MIPAS and correlative measurements are oscillating, but overall MIPAS seems to be far too dry. This can be explained as a systematic sampling error: cloudy scenes and scenes with very high water vapor must be omitted by the retrieval, i.e. only relatively dry scenes are sampled by MIPAS. MOHAVE-2009 Workshop # 2, 18-21 October 2010, University of Bern / IAP, Bern, Switzerland
Ozone MOHAVE-2009 Workshop # 2, 18-21 October 2010, University of Bern / IAP, Bern, Switzerland
Stratospheric Ozone ACE AIRS Scaling of profile only? TMF strat all night MOHAVE-2009 Workshop # 2, 18-21 October 2010, University of Bern / IAP, Bern, Switzerland
Stratospheric Ozone ACE AIRS Reference (MIPAS spectro-scopic data base, Band A + Band AB MIPAS spectroscopic data base, only Band AB MIPAS spectroscopic data base, only Band A HITRAN96, only Band AB HITRAN96, only Band A Scaling of profile only? Glatthor et al., ACP, 2007 TMF strat all night MOHAVE-2009 Workshop # 2, 18-21 October 2010, University of Bern / IAP, Bern, Switzerland
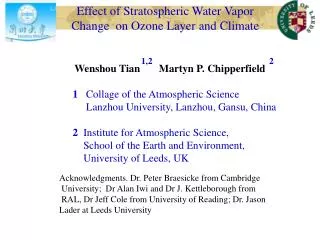
Tropospheric ozone CFH_JPL 3.20 CFH_JPL 3.10 TMF trop all night FPH_NOAA MOHAVE-2009 Workshop # 2, 18-21 October 2010, University of Bern / IAP, Bern, Switzerland
Summary comparison ozone • MIPAS stratospheric ozone is biased high by about 0.6-0.8 ppmv at the upper edge of the ozone maximum (~ 37 km), and tends to be high (although still within combined errors) at ~ 25 km and 43 km. • These biases are probably due to spectroscopic uncertainties ( improve selection of spectral signatures). Another explanation could be the temperature bias in this altitude range. • Comparison to AIRS: AIRS profiles seem to be scaled only (no change in profile shape). • MIPAS tropospheric ozone tends to be very high at lowermost end of the profile; deviations at altitudes above are < 100 ppbv. MOHAVE-2009 Workshop # 2, 18-21 October 2010, University of Bern / IAP, Bern, Switzerland
Tk: MA/UA Only with TMF (355H_30min) Max. Time Diff. = 4h Max. Distance Diff. = 1000km Examples of Individual profiles MA mode MA UA UA mode MOHAVE-2009 Workshop # 2, 18-21 October 2010, University of Bern / IAP, Bern, Switzerland
O3: MA/UA Max. Time Diff. = 4h Max. Distance Diff. = 1000km TMF-Launches FPH-NOAA Max. Time Diff. = 8h Max. Distance Diff.=1000km MA mode (ngt) MA mode (ngt) UA mode (day) MOHAVE-2009 Workshop # 2, 18-21 October 2010, University of Bern / IAP, Bern, Switzerland
H2O: MA/UA Max. Time Diff. = 6h Max. Distance Diff. = 1000km Max. Time Diff. = 12h Max. Distance Diff. = 1000km WVMS MIAWARA MA mode MA mode UA mode UA mode MOHAVE-2009 Workshop # 2, 18-21 October 2010, University of Bern / IAP, Bern, Switzerland
Summary MA/UA mode Measurements every 10 days (not a lot of coincidences). • Temperature (TMF): 2-3K colder stratopause, ±1-2K in mesosphere and 2K (MA) and 10K (UA) in mesopause. • Ozone (FPH & TMF): too structured (regularization?), ±1ppmv (20-50km). • Water vapor (MIAWARA & WVMS): Excellent comparisons above 60 km (±0.3ppmv), USLM too structured, 0.5-1ppmv wetter in H2O stratospheric max. MOHAVE-2009 Workshop # 2, 18-21 October 2010, University of Bern / IAP, Bern, Switzerland