Download
1 / 29
320 likes | 616 Vues
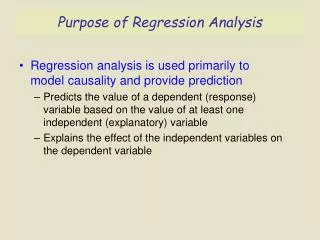
Application of regression analysis. Economic structure and air pollution in a transition economy: The case of the Czech republic. Gabriela Jandov á Michaela Krčílková. Structure of presentation. Definition of regression model Compilation of regression model Analysis of the results.

E N D
Applicationof regression analysis Economic structure and air pollution in a transition economy: The case of the Czech republic Gabriela Jandová Michaela Krčílková
Structure of presentation Definition of regression model Compilation of regression model Analysis of the results
I. Regression model • represents reality by using the system of equations. • explains relationship between variables. • enables quantification of these relationships.
Conceptual model Hypotheses Equations Data collection Calculation Verification Errors of the model II. Compilation of regression model
Compilation of regression model Conceptual model • is a graphical scheme. • serves for specification of sought-after mutual relations. • is a tool for defining of investigation matter. • should clarify our minds and help during determination of researching methods.
Agriculture Industry Services Our conceptual model Political system Economic system Individual people INPUTS: production resources OUTPUTS: products, waste Ecological system Air Soil Water Organisms
Compilation of regression model Hypotheses • are formulated expectations and suppositions. • Theirs confirmation or rejection is the goal of the regression analysis.
Our hypotheses • There is a relationship between economic structure and air pollution. • Industry is the biggest polluter of air. • There is a significant improvement of air quality during the 90th. Decrease of functioning of economy is not a cause of this fact.
1. Compilation of regression model Equations • should involve mainly essential relations between examined phenomenons, which have permanent character. • consist from explained and explanatory variables. • Partial correlation coefficients measure the effect of given explanatory variable on explained variable.
Measurability Accessibility Conclusiveness Testify ability Standardized methods of attaining 2. Compilation of regression model Requests on the variables: Equations • Comparability • Time series • Inter-independence • Uniqueness • Convenience
Our equations Yn = gn1X1 + gn2X2 + gn3X3 + en Where:Yn= dependent variables (NO,CO, Dust) X1= Gross value added in agriculture X2= Gross value added in industry X3= Gross value added in services e = Random error term g1g2g3 = partial correlation coefficients
Compilation of regression model Data collection Sources: • Statistical office´s reports • Library • Internet • Journal • Interview
1. Our data • Underlying data necessary for compilation of basic matrixes have been acquired from regional branches of Czech statistical office and from Czech Hydrometeorological office. Form of indicators of one region.
2. Our data • To acquire underlying data was necessary to contact all 14 regions.
3. Our data • Underlying data were adjusted and used for compilation of basic mattrixes. Example of basic mattrixes for NOx
Compilation of regression model Calculation • Ordinary least square method (OLS) • Two stage least square method • Instrumental variables • Maximum likelyhood method • General least square • Non-linear least square
Our calculation • Method of callculation: OLS • Results:
Compilation of regression model Verification • statistical verification • R-squared • R2 should be equal at least 0,66 • t-statistic • Every attained t-value should be higher than critical t-values mentioned in statistical tables • F-statistic • Every attained F-value should be higher than critical F-values mentioned in statistical tables • confidence interval • Estimated intervals have not include zero. • logical verification
1. Verification of our model Statistical verification
2. Verification of our model Statistical verification • Confidence interval:
Verification of our model Logical verification • Coefficients of industry have a positive slope. • Coefficients for services and agriculture have negative slope.
Compilation of regression model Errors of the model • Indicators of the errors • Low value of R-squared • Coefficients are not significant • Zero lies in the confidence intervals • Reasons of the errors: • Bad choice of variables • Omission of important factors • Equations are not identificated • Errors in data collection • Low number of executed observation
Experiments with our model • Calculation with additive constant
III. Analysis of the results • is an important step for correct interpretation of the model. • is crowned and concluded by confirmation or rejection of hypothesis.
1. Analysis of results First hypothesis There is a relationship between economic structure and air pollution. • The significance of coefficients comfirms our first hypothesis.
2. Analysis of results Second hypothesis • The coefficients for industry have the biggest value and positive slope. This fact confirms our second hypothesis. Industry is the biggest polluter of air.
3. Analysis of results Third hypothesis There is a significant improvement of air quality during the 90th. Decrease of functioning of economy is not a cause of this fact. • All coefficients decrease during the time, that confirms our third hypothesis.
Conclusion • All hypotheses are confirmed. • Our recommendation is: • to use the model in the conditions of non-transition economy. • to use the model in a country with higher number of regions.