Download
1 / 29
300 likes | 328 Vues
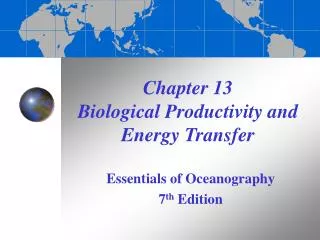
ESTIMATING OCEANIC PRIMARY PRODUCTIVITY:. AN EVALUATION OF OCEAN COLOR ALGORITHMS AND GENERAL CIRCULATION MODELS. Vincent S. Saba, Marjorie A.M. Friedrichs, Mary-Elena Carr, and the PPARR4 team. Background. Primary Productivity Algorithm Round Robin (PPARR):

E N D
ESTIMATING OCEANIC PRIMARY PRODUCTIVITY: AN EVALUATION OF OCEAN COLOR ALGORITHMS AND GENERAL CIRCULATION MODELS Vincent S. Saba, Marjorie A.M. Friedrichs, Mary-Elena Carr, and the PPARR4 team
Background Primary Productivity Algorithm Round Robin (PPARR): - Evaluate algorithms that estimate primary productivity (PP). - Ocean color (SAT) and biogeochemical circulation models (BOGCM). - Benefits: Improve future PP and ecosystem models, global marine carbon fixation estimates, understand the variability of PP.
Background Primary Productivity Algorithm Round Robin (PPARR): - PPARR2: Campbell et al. 2002 - PPARR3a: Carr et al. 2006 - PPARR3b: Friedrichs et al. in press - Fourth phase (PPARR4): Comparemodel estimates of PP to in situ data at various marine ecosystems.
3 2 4 1 5 7 6 9 8 1. BATS (n = 197), 1988-2003 6. Arabian Sea (n = 42), 1995 2. NABE (n = 12), April-May 1989 7. HOT (n = 139), 1989-2005 3. NEA (n = 52), 1993-1998 8. Ross Sea (n = 164), 1996-2006 4. Black Sea (n = 43), 1992-1999 9. APFZ (n = 12), Dec. 1997 5. MED (n = 202), 1984-2007
Acknowledgements Funding: NASA Ocean Biology and Biogeochemistry Program. PPARR4 team: David Antoine, Robert Armstrong, Ichio Asanuma, Michael Behrenfeld, Val Bennington, Laurent Bopp, Erik Buitenhuis, Aurea Ciotti, Scott Doney, Mark Dowell, Stephanie Dutkiewicz, John Dunne, Watson Gregg, Nicolas Hoepffner, Takahiko Kameda, Ivan Lima, John Marra, Frédéric Mélin, Keith Moore, André Morel, Robert O’Malley, Jay O’Reilly,Michael Ondrusek, Michele Scardi, Tim Smyth, Shilin Tang,Jerry Tjiputra, Julia Uitz,Marcello Vichi,Kirk Waters, Toby Westberry, Andrew Yool.
Methods • Models: Estimate integrated PP to the 1% light-level • (mg C m-2 d-1). • 12 BOGCM models • Provided with date, location, day length. • 23 SAT models • Depth integrated or resolved. • Wavelength integrated or resolved. • Provided with in situsurface chlorophyll & SST, modeled PAR and MLD. Provided with SeaWiFSsurface chlorophyll & PAR for all stations post-SeaWiFS.
Model Skill Analysis Root mean square difference (RMSD). Model misfit Target diagrams.
Model skill for each region Lower RMSD = Higher model skill Mean RMSD NEA HOT MED BATS APFZ NABE Black Sea All Regions Arabian Sea Ross Sea (in situ) Ross Sea (on deck)
Gregg Eppley VGPM CbPM Follows OPAL BATS, n = 197 (Mean Obs. PP = 528.68 (+/- 212) mg C m-2 d-1) SAT models BOGCMs
NABE, n = 12 (Mean Obs. PP = 894.76 (+/- 336) mg C m-2 d-1) SAT models BOGCMs
Northeast Atlantic, n = 52 (Mean Obs. PP = 534.86 (+/- 313) mg C m-2 d-1) SAT models BOGCMs
HOT, n = 139 (Mean Obs. PP = 513.12 (+/- 152) mg C m-2 d-1) SAT models BOGCMs
Ross Sea, n = 144 (Mean Obs. PP = 1177.57 (+/- 849) mg C m-2 d-1) SAT models BOGCMs
SAT,DI,WI SAT,DR,WI SAT,DR,WR BOGCM Over-estimates PP variability Under-estimates PP variability Over-estimates PP Under-estimates PP
SAT,DI,WI SAT,DR,WI SAT,DR,WR BOGCM
SAT,DI,WI SAT,DR,WI SAT,DR,WR BOGCM
SAT,DI,WI SAT,DR,WI SAT,DR,WR BOGCM
MED Mean RMSD NEA All BATS Ross Sea HOT APFZ
All SAT Models, All Regions All SAT Models SAT DI,WI Models Mean SAT model misfit SAT DR,WI Models SAT DR,WR Models Log(in situ chlorophyll)
All BOCGMs, All Regions R2 = 0.03 Mean BOGCM misfit Log(in situ chlorophyll)
Pelagic Coastal Ross Sea MED In situ Chlorophyll variability NEA BATS APFZ Black Sea Arabian Sea HOT NABE In situ PP variability
SAT Models Pelagic Coastal MED Black Sea Mean SAT model misfit NEA NABE APFZ Ross Sea Arabian Sea HOT BATS In situ PP variability
BOGCMs Mean BOGCM misfit
Mean SAT model misfit Depth (m)
BATS Log(obs. PP) Correlation -0.61 Mean SAT PP = No increase. Mean SAT model misfit Fluor. chlor. = No increase. HPLC chlor. = Increase.
HOT Log(obs. PP) Correlation -0.82 Mean SAT PP = No increase. Fluor. chlor. = No increase. Mean SAT model misfit HPLC chlor. = Increase.
HPLC http://hahana.soest.hawaii.edu/hot/ Fluorometric
Summary - Models had highest skill in NABE, Arabian Sea, and APFZ; lowest skill in MED and Ross Sea. - SAT models typically had higher skill than BOGCMs. - DR,WI - DR,WR - SAT models performed better in BATS when SeaWiFS chlorophyll was used as opposed to in situ. Opposite was true at NEA and APFZ. SeaWiFS versus modeled PAR did not significantly affect skill. - SAT models tended to underestimate PP at low chlorophyll values and overestimate PP at high chlorophyll values. - Coastal regions: PP was typically overestimated. - Pelagic regions: PP was typically underestimated. - In pelagic regions: as depth increased, PP was underestimated.
Summary - Increasing trend of PP at BATS and HOT was not captured by the models. - For SAT models, this may be a function of the chlorophyll measurement (fluorometric vs. HPLC). - Both HOT and BATS show an increase in HPLC measured chlorophyll but do not show an increase in fluorometric chlorophyll. - Zooplankton biomass is also increasing at BATS and HOT (Steinberg et al. unpublished). - Ocean color calibrated to HPLC rather than fluorometric ? - Implications for studies that use PP models to assess the effect of climate change on marine carbon fixation.