Download
1 / 7
70 likes | 323 Vues
Demand review. Demand graphs can be read in two ways: As price decreases, demand increases As price increases, demand decreases. Demand review. When factors other than price effect the demand- the change in the graph is called a “demand curve shift”

E N D
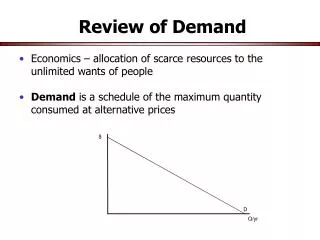
Demand review • Demand graphs can be read in two ways: • As price decreases, demand increases • As price increases, demand decreases
Demand review • When factors other than price effect the demand- the change in the graph is called a “demand curve shift” • When the price effects demand we see change/movement along the demand curve • Demand Elasticity: responsiveness of quantity demanded to a change in price. Ex. Drug addicts want to get “high” no matter how much the price increases. Certain quantities of life saving drugs are needed no matter what the cost=inelastic. If a resturant can get a better deal on ketchup x vs. y they will buy x (both taste the same and are needed in large quantities)
Sumarizing Supply The ability and willingness of sellers to make goods and services available for sale
Effect of price on quantity supplied When all other factors remain unchanged… *price increases- quantity supplied (s) increase (s) *price decreases-quantity supplied (s) decreases
Changes in Demand & Supply • Demand: changes in tastes, incomes, availability of related items, political sentiments, population growth/decline… • Supply: changes in production methods (technology) and costs, weather, politics…
Supply • Key concept= supplying things is costly and we must pay ppl to supply things we want. The more we want them to supply, the higher their costs of supplying each additional unit. The cost of production increases with each additional unit.
Graphs • Don’t think of supply as what the producer wants in exchange for the good but rather at what minimum is the producer willing to give up their good (due to costs)