Download
1 / 21
210 likes | 321 Vues
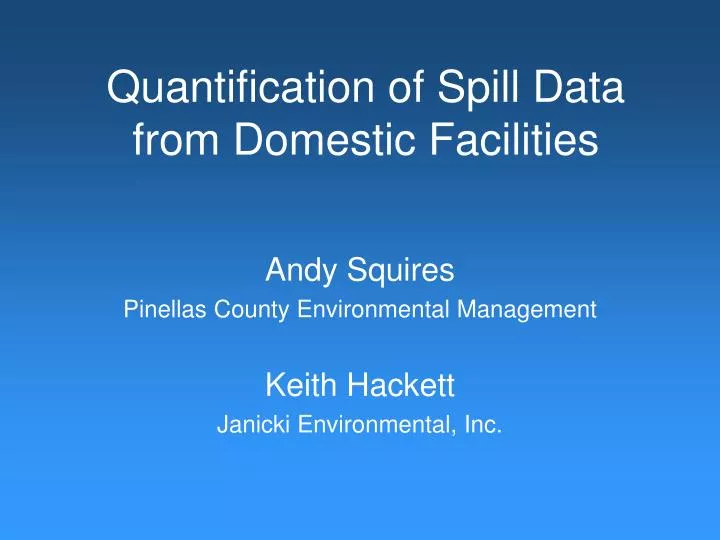
Quantification of Spill Data from Domestic Facilities. Andy Squires Pinellas County Environmental Management Keith Hackett Janicki Environmental, Inc. WASTEWATER SPILL DATA COLLECTION. County concerned over significance of Pinellas County spills

E N D
Quantification of Spill Data from Domestic Facilities Andy Squires Pinellas County Environmental Management Keith Hackett Janicki Environmental, Inc.
WASTEWATER SPILL DATA COLLECTION • County concerned over significance of Pinellas County spills • Reviewed spill records at FDEP that occurred in Pinellas County (Oct 1, 2002-Sept 30, 2003) • Found Pinellas County’s wastewater plants contributed 5-6 % of total reported spills volume in Pinellas County • Total annual spill volume within Pinellas County ~ 25 million gallons • Nutrient loading impact to bay questioned • Reviewed spill records at FDEP & EPC for Hillsborough County
COMPLICATIONS AND PROBLEMS • Spill records not standardized • Spill volume estimates often were very rough estimates • Not all spills were raw wastewater, many were reclaimed water • Not all spills reached a surface water body • Originally assumed influent TN averaged about 50 mg/l • WWTP operators indicated influent TN more typically 33-35 mg/L • Storm event influent TN concentration can be much lower • Accuracy of spill database questioned
REEVALUATION OF SPILL IMPACTS ON TAMPA BAY • TBEP checked records at one WWTP • Pinellas County DEM staff revisited FDEP & EPC spill records • Revised spill database • TBEP tasked Janicki Environmental to calculate potential loading impacts to bay
PINELLAS COUNTY UTILITIES SPILL REPORTING • Within 24 hours, regardless of spill size, notify PC Health Dept. & FDEP • If discharge (or potential to discharge) to Waters of the State, fax & mail report to FDEP five days after spill • If over 1000 gallons, notify State Warning Point ASAP and within 24 hours
PINELLAS COUNTY UTILITIES SPILL REPORTING • Final spill report with next scheduled Discharge Monitoring Report • site map of collection stations • data results • corrective action
Background • Received data from domestic facilities in Hillsborough and Pinellas counties • 934 reported events between October 1, 2002 to October 31, 2003. • 843 events led to potential loads (i.e., were not completely contained) • Most spill volumes were estimated • When concentration data were not available, two estimates were used (high and low)
Spill Categories • Spills were classified into six categories • Raw (624, 14 above one MilGal) • Treated effluent (10, 0 above one MilGal ) • Discharge effluent (29, 13 above one MilGal) • Partially treated effluent (51, 12 above one MilGal) • Reclaimed water (118, 13 above one MilGal) • Miscellaneous (11, 0 above one MilGal) • Total (843 spills, 52 above one MilGal)
Nitrogen Concentration Ranges • Only 5.5% of spill records reported a nitrogen concentration • Assumptions • Raw: Low = 30 mg/L High = 50 mg/L • Reclaimed: Low = 6 mg/L High = 16 mg/L • Partially Treated: Low = 6 mg/L High = 26 mg/L • Treated: Low = 6 mg/L High = 22 mg/L
Spill Data Note: 1 ton = 909 kg
Spills by Bay Segment • Spills occurred in the following segments: • Hillsborough Bay • Middle Tampa Bay • Boca Ciega Bay • Old Tampa Bay
Summary • Nitrogen load from spills as % of total N load per month by Segment: • Boca Ciega Bay = 0 – 8% (Corrected) • Hillsborough Bay = 0 – 2% • Middle Tampa Bay = 0 – 4% • Old Tampa Bay = 0 – 26%
Total Annual Spill Volumes in Pinellas County FY01-02: 260,000 gallons FY02-03: 25,000,000 gallons FY03-04: 3,700,000 gallons
Findings • Spill volumes were rough estimates • FDEP and EPC records missing information from some WWTPs • WWTP operators say submittal of spill information to authorities is inconsistent • Very high spills occurred during year assessed • A few WWTPs contributed to most of spill volume • FDEP & EPC have existing corrective measures for high spill facilities
Recommendations • Use standardized forms • FDEP/EPC spill records should be checked for accuracy by WWTP staff • Repeat spill data collection and analysis for another year • Check for bay water quality impacts from wastewater spills previously reported • Use same day WWTP influent TN concentrations to estimate spill loads that occurred during storm events