Download
1 / 125
1.25k likes | 1.41k Vues
1.7. Ecological relationships & energy flow. Ecology is the study of living things in their environment. Ecosystem =. community + environment. (all the living things). (all the surroundings). What is an Ecosystem?.

E N D
1.7 Ecological relationships & energy flow
Ecosystem = community + environment (all the living things) (all the surroundings)
What is anEcosystem? An ecosystem is the name given to all the living things, community, and their non-living environment in a particular area. The living organisms are all dependent on each other through feeding relationships.
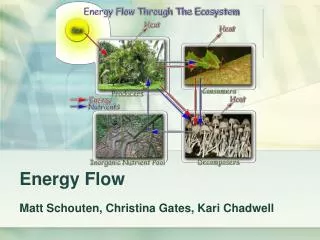
Energy flow • Life can exist on Earth because of sunlight energy. • Plants capture light energy through the process of photosynthesis. • And make organic compounds such as carbohydrates
Energy is transferred through the ecosystem by feeding relationships.
Finding out about populations in a habitat Fieldwork provides information about what plants and animals live in a particular habitat and their numbers. It is therefore necessary • to be able to identify organisms, using keys • and understand the different sampling techniques used to count them.
We cannot actually count every plant or animal in a particular place, so we count a sample of the population to calculate an estimated population size.
Sampling populations You should understand the importance of random sampling. This is essential to avoid observer bias. WHAT DOES THIS MEAN? This means that the person collecting the data does not affect the result deliberately, e.g. by only counting in one part.
QUADRATS Quadrats are usually used to count plants, but can also be used to count slow moving animals such as snails.
Lay out two tapes at right-angles in the area you want to sample. • Use random number tables to pick co-ordinates: • quadrats should be placed randomly so that a representative sample is taken. • Place a quadrat (of suitable size) at that point and count the organisms within it. • Repeat using using at least 20 quadrats, at other random coordinates across the grid: • repeating increases the reliability. • collecting across the whole grid areareduces the effect of an unusual distribution • Calculate the average number of organisms in each quadrat • Use the average to calculate an estimated total number of organisms in the grid area.
Quadrats can be used to estimate a population in an area which is fairly uniform. Examples include lawns, woods and open ground. There are three ways to count organisms to estimate population size: • 1. Density (calculating the number of organisms per m2); • 2. Frequency (number of number of quadrats that contain the organism) • 3. Percentage cover (estimating the percentage of the grid area that contains the organism)
Percentage cover is an easy way to estimate population size. • However, a disadvantage is that it is difficult to estimate exactly what percentage of the quadrat is actually covered by a particular type of plant, so it is normal to round up to the nearest 10%. An exception is if there are any plants with a percentage cover of 1 -5% - this is recorded as 1 and not 0. • This makes the results less reliable than estimating the density.
BELT TRANSECTS Belt transects can be used to investigate changes in the distribution of organisms along a particular habitat, e.g. due to changing abiotic factors such aslight intensity
Sampling animal populations How do we know that the invasive harlequin ladybird is affecting the populations of native ladybirds?
used to collect small invertebrates. • POOTERS
SWEEP NETS • Sweep nets allow you to collect large numbers of invertebrates that live in low vegetation (stems, tall grasses, flowers etc) or in rivers and ponds • Sweep netting involves making a large rapid sweep with a net in between large paces. • The invertebrates can be collected in a tray and counted
PITFALL TRAPS Stones to prevent rain flooding the trap or birds or other predators from removing the trapped animals jar sunk in a hole in the ground
Pitfall traps must be properly set up: • the top of the jar should be level with the soil surface • cover the trap with a stone or piece of wood to keep out the rain, to make it dark and to stop birds eating your catch • the traps must be checked often to avoid the animals escaping or being eaten before they are counted • as with most methods a large number of traps makes results more reliable and minimises the effects of unusual results
pooter exam question • http://www.bbc.co.uk/scotland/learning/bitesize/standard/biology/biosphere/investigating_an_ecosystem_rev5.shtml
DEFINITIONS habitat the place where an organism lives the environment the surroundings in which an organism lives it is made up of abiotic and biotic factors
These are the non-living, physical parts of the environment, including: abiotic factors • Wind • Water • pH • Light • Temperature p53 draw a table to summarise how to measure these abiotic factors
These are the living parts of the environment, including: biotic factors • Predators • Disease • Waste produced by living organisms
Case Study plant distribution in a sand dune system See worksheet (pages 54 -55 textbook) Each organism is adapted (suited) to the environment in which it lives. This case study tries to explain why specific plants live at different distances from the seashore.
1km sand dune, divided into 3 sections. • Section 1 from the start of the first sand dune inshore. • Section 2 half way between 1 and 3. • Section 3 from the end of the last dune to to the start of the woodland. • Describe the area that was being studied. • What sampling method was used to study the distribution of plants along the sand dunes? • How many samples were taken? • 3 interrupted belt transects • 20 at each site
the average percentage cover • of marram grass, common heather and gorse • along each transect • Name the biotic data collected. • Name the abiotic data collected • average light intensity reaching the ground • Average soil moisture • Average pH
Marram grass: can grow in very unstable conditions such as those found near the shore, where the sand is constantly moving in the wind. It helps to stabilise the dunes, by holding the sand together for other plants to grow in. • Heather: small shrub, prefers stable moist soil • Gorse: large shrub, prefers very stable soil with lots of moisture and nutrients • Describe the conditions in which each of the plants prefers to grow.
Describe the trends shown by the graphs. • Marram grass is only common in transect 1 • Heather is not found in transect 1 but is found in transect 2 • Gorse is most common in transect 3, but uncommon or absent at transects 1 and 2.
Use the biological knowledge about the 3 plants and the abiotic data to explain the trends. • Marram grass can grow at the beginning of the dunes where there is not much water available in the sand, 20%. • It needs high light intensity to grow, 95%. • Further inland, where the conditions are more stable, there is less light and there is more moisture, so the other plants out-compete the marram grass.
Heather cannot grow in transect 1 because there is not enough moisture. • Gorse grows best in transect 3 where there is most water, 60%. • Gorse is a large shrub and creates shade, preventing the marram grass and heather from growing.
What features of this investigation make the results reliable? How could the reliability be increased further? • The plants were counted in 20 quadrats at each transect and an average was calculated. • ******
Explain why you think this a fair test? State the following: the independent variable the dependent variable the controlled variables • Only one thing was being changed. • The position of the transect along the dune. • Percentage plant cover in each quadrat • Size of the quadrat • Time of the year the measurements were taken.
It was not possible to keep the wind, light intensity, soil moisture or pH controlled. However these factors were measured and helped to explain the presence or absence of the plants at the different transects.
Using and constructing keys
Keys are used to identify unknown organisms. Dichotomous keys, used in biology, consist of a series of two part statements that describe observable features of organisms. • At each step of a dichotomous key you are presented with two choices. As you make a choice about a particular feature or characteristic of an organism you are led to a new branch of the key. Eventually you will be led to the name of the organism that you are trying to identify.
Constructing a key for objects in a pencil case 1. Look at the group of objects and separate them into two groups based on a single observable feature. 2. Look at each group separately and again separate each into two groups based on a single observable feature. 3. Continue until each group has only one object. A dichotomous key may be shown as a branching diagram or as a numbered key.
alien key Carefully examine and think about the observable features of the 8 aliens and create a dichotomous key using some of these characteristics.
USING KEYS Use the key booklet to identify the organisms described below.
Broad leaved trees This trees leaves are green all over and have a hairy upper surface. They are rounded with a pointed tip and they are larger on one side of the midrib than the other. The edges of the leaves are toothed, but they have no lobes or prickles. The stalk is short and rounded and bears a single leaf.
LEAF LITTER This wingless invertebrate has a waistless segmented body with 3 pairs of legs. It uses a spring under its abdomen to move by jumping.