Download
1 / 22
220 likes | 358 Vues
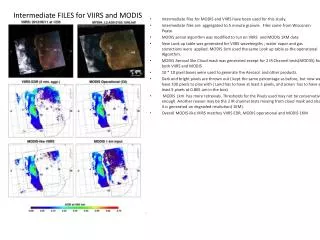
Preliminary analysis for MODIS and VIIRS by using MICROS. Xingming Liang. SST bands. Processing Specifics. Characteristics VIIRS versus MODIS. Comparison of Histograms. AVHRR Ch3B like. MODIS-AUQA coefficient used to simulate VIIRS BTs. VIIRS coefficient used to simulate VIIRS BTs.

E N D
Preliminary analysis for MODIS and VIIRS by using MICROS Xingming Liang
AVHRR Ch3B like MODIS-AUQA coefficient used to simulate VIIRS BTs VIIRS coefficient used to simulate VIIRS BTs
AVHRR Ch4 like • By using AQUA Coeff. to simulate VIIRS BTs for Ch3 and Ch4, the M-O biases and SDs are all reduced. • NOBS in VIIRS is 4 times lager than MODIS.
AVHRR Ch5 like • Different from Ch3 and Ch4, using AQUA Coeff. to simulate VIIRS Ch5 BTs, the M-O biases are SDs increase.
SST Large VIIRS SST biases may be due to SST coeff.
Comparison of gloal M-O and SST maps -- MODIS/Terra vs MODIS/AQUA -- -- VIIRS/VIIRS Coef. vs VIIRS/AQUA Coef. --
AVHRR Ch3B like • M-O bias in AQUA is 0.3 K larger than TERRA; • High latitude with high M-O bias, more significant for AQUA. • Adjusting Clear-sky mask for MODIS and VIIRS is needed. MODIS-TERRA Ch20 VIIRS-NPP Ch12, VIIRS Coeff
AVHRR Ch3B like • Using AQUA Coefficient to simulate VIIRS BT • M-O biases are reduced from -1.3 K to -1.0 K ; • More Gaussian distribution. • Remaining bias may be due to • inaccuracy in the proxy sensor BTs • CRTM simulation MODIS-AQUA Ch20 VIIRS-NPP Ch12, AQUA Coeff
AVHRR Ch4 like MODIS-TERRA Ch31 VIIRS-NPP Ch15, VIIRS Coeff
AVHRR Ch4 like MODIS-AQUA Ch31 • M-O biases In near equator are significantly reduced by using AQUA Coefficient to simulate VIIRS BT VIIRS-NPP Ch15, AQUA Coeff
AVHRR Ch5 like MODIS-TERRA Ch31 MODIS-TERRA Ch32 VIIRS-NPP Ch16, VIIRS Coeff
AVHRR Ch5 like MODIS-AQUA Ch32 VIIRS-NPP Ch16, AQUA Coeff
Comparison of dependencies VIIRS-NPP (Ch12, VIIRS Coeff) and MODIS/Terra & AQUA (Ch20)
VIIRS dependences are likely more obvious than MODIS. • Sensor view angles for MODIS and VIIRS are not negative value, which is inconsistent with AVHRR • current John is working on this issue.
Conclusion • Adjusting clear-sky mask for MODIS and VIIRS is needed. • SST coefficients need to be recalculated for MODIS and VIIRS. • Using AQUA coefficient to simulate VIIRS BTs, M-O biases are reduced in Ch3B and Ch4, but increase in Ch5. • The remaining bias may be due to inaccuracy in the proxy sensor BTs or CRTM simulation.