Download
1 / 23
230 likes | 392 Vues
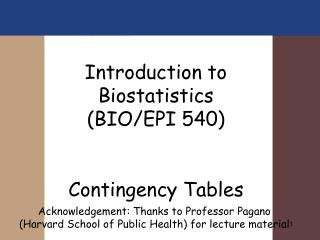
Introduction to Biostatistics (PUBHLTH 540) Hypothesis Testing. General Idea How unusual is the result? Test statistics Type I error (alpha level) p-value Type II error (beta level) Power=1-beta. Introduction to Biostatistics (PUBHLTH 540) Hypothesis Testing-General Idea.

E N D
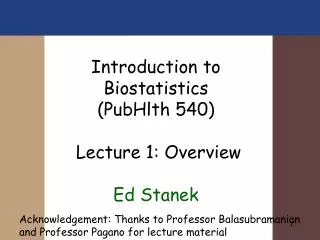
Introduction to Biostatistics (PUBHLTH 540)Hypothesis Testing • General Idea • How unusual is the result? • Test statistics • Type I error (alpha level) • p-value • Type II error (beta level) • Power=1-beta
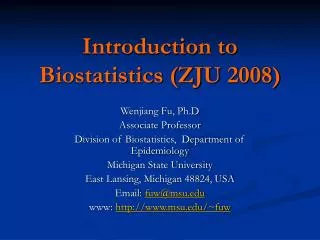
Introduction to Biostatistics (PUBHLTH 540)Hypothesis Testing-General Idea • Total cholesterol (mg/dl) is measured on a simple random sample of 32 women over the age of 60. Is there evidence that mean cholesterol is different in women of this age group as compared with women under age 50? • Estimate of TC: (see ejs09b540p36.sas) • Plot histogram of SRS of n=32 from women <50. (see ejs09b540p37.sas) Result is very unusual relative to what we’d expect from sampling. Conclude the mean is differnet. 244
Introduction to Biostatistics (PUBHLTH 540)Hypothesis Testing-General Idea • Histogram of distribution of sample means/standardized value- • need to know mean and variance of TC for women < 50. • use Z if variance is known, t if variance is estimated • for women < 50: 244
Introduction to Biostatistics (PUBHLTH 540)Hypothesis Testing-General Idea • Histogram of distribution of sample means • or … histogram of standardized values of the difference of the sample mean from the mean TC for women < 50 • need to know mean and variance of TC for women < 50. • use Z if variance is known, t if variance is estimated • for women < 50: 244
Introduction to Biostatistics (PUBHLTH 540)Hypothesis Testing-General Idea 244
Introduction to Biostatistics (PUBHLTH 540)Hypothesis Testing-General Idea z=8.08
Introduction to Biostatistics (PUBHLTH 540)Hypothesis Testing-General Idea z=8.32 z=8.3
Introduction to Biostatistics (PUBHLTH 540)Hypothesis Testing-General Idea • Is the result ‘unusual’? • Decide a level of ‘unusualness’ • usually set at values so that 5% of time, sample mean would be further away • If in either direction, then 2.5% on either side, and test is called ‘2-sided’ • If unusual is important only in one direction (drug lowers cholesterol), then put all 5% on one side • Null hypothesis is ‘usual’ or commonly accepted position. • Alternative hypothesis is what you want to ‘prove’
Figure 1. Histogram of sample means of n=32 for tc from Population of N=93 10 Percent 5 0 170 173 176 179 182 185 188 191 194 197 200 203 206 209 212 215 218 221 224 227 230 233 236 239 242 245 mn_samp Source: ejs09b540p37.sas 10/27/2009 by ejs Introduction to Biostatistics (PUBHLTH 540)Hypothesis Testing-General Idea Null Hypothesis:
Figure 1. Histogram of sample means of n=32 for tc from Population of N=93 10 Percent 5 0 170 173 176 179 182 185 188 191 194 197 200 203 206 209 212 215 218 221 224 227 230 233 236 239 242 245 mn_samp Source: ejs09b540p37.sas 10/27/2009 by ejs Introduction to Biostatistics (PUBHLTH 540)Hypothesis Testing-General Idea AlternativeHypothesis
Figure 1. Histogram of sample means of n=32 for tc from Population of N=93 10 Percent 5 0 170 173 176 179 182 185 188 191 194 197 200 203 206 209 212 215 218 221 224 227 230 233 236 239 242 245 mn_samp Source: ejs09b540p37.sas 10/27/2009 by ejs Introduction to Biostatistics (PUBHLTH 540)Hypothesis Testing-General Idea 2-sided test Unusual Unusual
Figure 1. Histogram of sample means of n=32 for tc from Population of N=93 10 Percent 5 0 170 173 176 179 182 185 188 191 194 197 200 203 206 209 212 215 218 221 224 227 230 233 236 239 242 245 mn_samp Source: ejs09b540p37.sas 10/27/2009 by ejs Introduction to Biostatistics (PUBHLTH 540)Hypothesis Testing-General Idea 1-sided test Unusual
Figure 1. One Sided test for a particular alternative and Histogram of sample means assuming null hypothesis is true based on of n=32 for tc from Population of N=93 10 Percent 5 0 170 173 176 179 182 185 188 191 194 197 200 203 206 209 212 215 218 221 224 227 230 233 236 239 242 245 mn_samp Source: ejs09b540p37.sas 10/27/2009 by ejs Introduction to Biostatistics (PUBHLTH 540)Power of a Test-General Idea 1-sided test Unusual
Figure 1. One Sided test for a particular alternative and Histogram of sample means assuming null hypothesis is true based on of n=32 for tc from Population of N=93 10 Percent 5 0 170 173 176 179 182 185 188 191 194 197 200 203 206 209 212 215 218 221 224 227 230 233 236 239 242 245 mn_samp Source: ejs09b540p37.sas 10/27/2009 by ejs Introduction to Biostatistics (PUBHLTH 540)Power of a Test-General Idea 1-sided test Unusual
Introduction to Biostatistics (PUBHLTH 540)Power of a Test-General Idea 1-sided test 1-sided test Unusual Unusual
Introduction to Biostatistics (PUBHLTH 540)Power of a Test-General Idea 1-sided test 1-sided test Unusual Unusual
Introduction to Biostatistics (PUBHLTH 540)Power of a Test-General Idea 1-sided test 1-sided test 1-sided test Unusual Unusual
Introduction to Biostatistics (PUBHLTH 540)Power- example • We know TC for males is normally distributed with mean 220, and variance 1524. Let us test the null hypothesis that the mean is 220, versus an alternative hypothesis that the mean is 205 based on a one sided test with n=25. What is the power of the test? • Figure out the rejection region under the null hypothesis in terms of the distribution of sample means. • Make a sketch. • Use the z-applet with an assumption that the alternative hypothesis is true to figure the power.
Introduction to Biostatistics (PUBHLTH 540)Power- example • Figure out the rejection region under the null hypothesis in terms of the distribution of sample means.
Introduction to Biostatistics (PUBHLTH 540)Power- example • Figure out the rejection region under the null hypothesis in terms of the distribution of sample means.
Introduction to Biostatistics (PUBHLTH 540)Power- example • Make a sketch.