Download
1 / 27
270 likes | 608 Vues
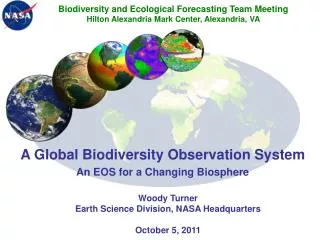
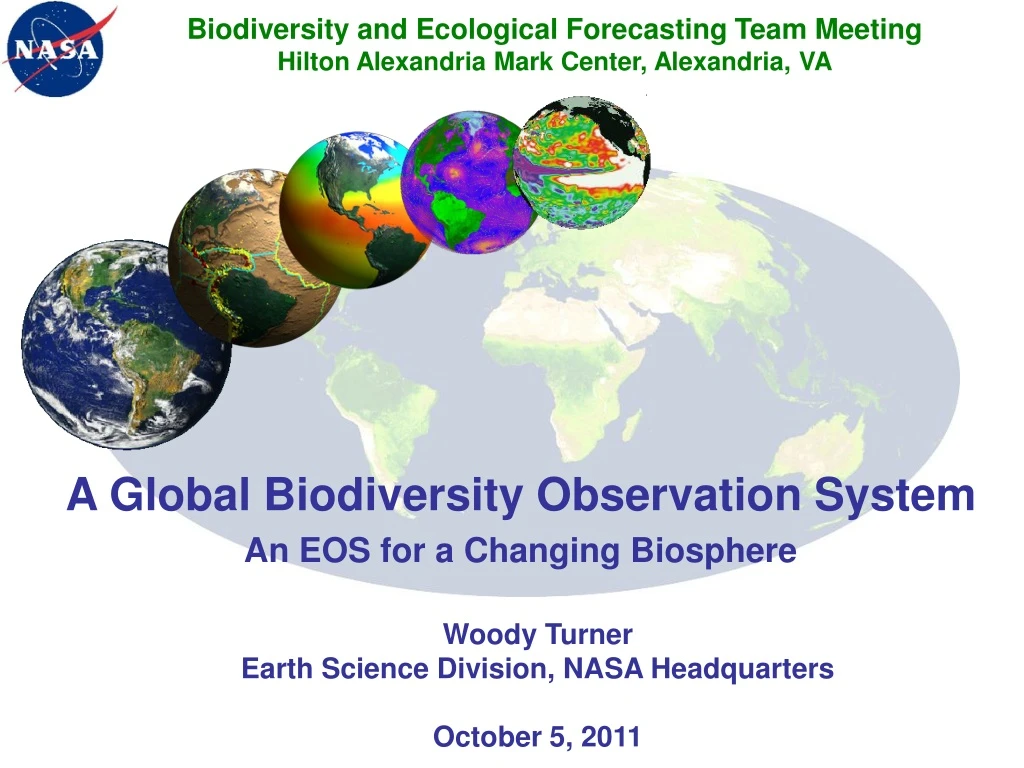
Biodiversity and Ecological Forecasting Team Meeting Hilton Alexandria Mark Center, Alexandria, VA. A Global Biodiversity Observation System An EOS for a Changing Biosphere. Woody Turner Earth Science Division, NASA Headquarters October 5, 2011. Taking Wisdom from the Market.

E N D
Biodiversity and Ecological Forecasting Team Meeting Hilton Alexandria Mark Center, Alexandria, VA A Global Biodiversity Observation System An EOS for a Changing Biosphere Woody Turner Earth Science Division, NASA Headquarters October 5, 2011
Taking Wisdom from the Market “Diversification is not only the first important thing investors should think about, but the second and the third, and probably the fourth and fifth, too” John C. Bogle (82) founder of the Vanguard Group in The Wall Street Journal September 10, 2011, Jason Zweig’s The Intelligent Investor, in which he also referred to the stock market as “spasmodic”
Our Ever-Changing Earth (source: Smithsonian NASM Looking at Earth TIROS Page)
We Are a Driver of Global Change (But Can/Will We Take Responsibility?)
Looking at Earth as a Planet (from Apollo 17 Crew; December 7, 1972)
The Bretherton Report: Earth System Science’s Founding Text and Plan “The understanding of global change on time scales of decades to centuries is a challenge of great urgency.” Earth System Science: A Closer View p.16 (1988) Progress requires vision and persistence; we’ve stuck with this vision for >20 years.
Biodiversity: the Variability of Life on Earth (Source: Wikipedia) Helicobacterium pylorii Genome from: http://biocrs.biomed.brown.edu/Books/Chapters/Ch%2038/Pylori-Genome.gif (Source: Wikipedia) Biodiversity is life’s response to a changing planet as well as a driver of environmental change at all spatial scales. It captures our evolutionary past and provides opportunities for our living future. We, and all life, need biodiversity for the same reason we need a diverse financial portfolio—things change.
Where’s the Biodiversity? (Earth System Science: A Program for Global Change (1988))
The New Century of Biology?(with apologies to Mendel, Wallace, Darwin) (photos source: Wikipedia) BOYLE LAVOISIER FARADAY RUTHERFORD EINSTEIN BOHR Who’s Next? But it’s contingent on biodiversity: the key to unlock the door to all levels of biological discovery. A new age of opportunity awaits!
Lord May’s Lament: There’s So Much We Don’t Know BIOLOGY (http://ccinfo.ims.ac.jp/periodic/periodic.jpg)
Yet Time Is Short! (Nature 471:51-57; 3/3/11) (Science 328:1164-1168; 5/28/10) So, what do we do?
How About an EOS for Life on Earth? ? 1988 2011 It’s now possible.
Why Global Data Products? • Consistency across data comparability across space and time • Shared methods • Standardization of formats • Cost efficiencies associated with designing, implementing and integrating systems to produce the products • Common scorecard for users • Open to improvements from the global community • Incentive and instruction for national/or and regional monitoring systems • Provision of a global context for local actions and management decisions • Avoid “leakages” of economic or other impacts from one country to another, which can be a problem with national-level assessments “Scale-ability” spatially is a necessity
Two components: Ecosystems and Species • Calls for regular global sampling along with a global network of regional monitoring programs for indicator populations • For Ecosystems: global land cover via remote sensing (for oceans, suggests combining regional analyses but can also capture some ocean conditions globally with satellites via NPP per OSU/Behrenfeld, others) • For species: Living Planet Index (LPI), global assessments, and regional monitoring • Notes the importance of a composite index to integrate ecosystems and species change data (e.g.: Biodiversity Intactness Index) • Suggests Group on Earth Observations GEOSS and UNEP play key roles in forming and supporting the monitoring network
Do We Have the Pieces We Need to Start a Global Biodiversity Observation Network? • Global measures of land cover and ocean productivity at different scales • Global measures of the status of key elements of biodiversity (e.g., species) at different scales • A means of integrating these global measures • An institutional framework to establish and oversee the monitoring network
GEO Global 30m Land Cover Annual land cover continuous variables Mid-decadal year land cover types • Quantitative annual continuous measures of per pixel percent tree, shrub, herbaceous, water, snow/ice, and barren cover. • Change products annually • 2010 baseline • Land cover categories (TBD) consistent with FAO Land Cover Classification System (LCCS) • Maps and statistical estimates of major land cover types • Complementary with other global land cover products (e.g., MODIS land cover, Globecover) • 2010 baseline, 5-year updates (from USGS/Tom Loveland)
The MODIS-ization of LandsatForest cover loss in Indonesia, 2000 to 2010 15,692 Landsat Enhanced Thematic Mapper Plus images from 1999 to 2010 Open data archives + cloud computing = mapping the globe! Primary forest cover loss Other forest cover loss Nearly 1 million hectares per year, almost half in primary forests (from SDSU/Matt Hansen)
Improving Temporal/Spatial Resolution and Capturing the 3rd Dimension • Temporal: AVHRR, MODIS, MERIS, Sentinel-3 • Spatial: Commercial satellites, airborne sensors • Active: radar (Japan, Sentinel-1) lidar (GLAS, airborne)
NPP for Oceans Standard Product: Net Primary Production using MODIS CHL and SST, SeaWiFS PAR, and z_eu = f(CHL) as inputs to the VGPM (from http://www.science.oregonstate.edu/ocean.productivity/index.php) Monthly Net Primary Production for November 2002
ZSL/WWF Living Planet Index • Estimates annual rates of change for 7953 populations of 2544 mammal, bird, reptile, amphibian, and fish species • Global overall LPI • Combines Temperate (Palearctic and Nearctic realms and marine species north and south of the Tropics) and Tropical ( Afrotropical, Indo-Pacific and Neotropical realms and marine species within the Tropics) LPIs • Can disaggregate into: • Terrestrial, Marine, and Freshwater LPIs • LPIs by realm • Track individual species • Also Red List Index for changes in extinction risk • Stuart et al. (Science 328:177; 2010) call for better Barometer of Life • Adding taxonomic depth to the Red List (Source: WWF’s Living Planet Report 2010 Summary)
BII: A Composite Index to Integrate Habitat and Species Data • Biodiversity Intactness Index (BII) from Scholes and Biggs in Nature (434:45-49; 2005) • Links land use classes to ecosystem types and population impacts for species groups or groups of functional types • Comparable directly within and across scales (tested at national, provincial, and local scales in South Africa, as well as across southern Africa • Presents results as percent intactness = percent remaining of presumed pre-modern levels • Can be disaggregated by ecosystem, political unit, taxon, land use • Includes an error bar for uncertainty
Group on Earth Observations (GEO) A Possible Framework? • Detailed Implementation Plan completed in May 2010 • Includes sections and working groups with specific • activities and deliverables for: • Genetics / Phylogenetic Diversity (WG 1) • Terrestrial Species Monitoring (WG 2) • Terrestrial Ecosystem Change (WG 3) • Freshwater Ecosystem Change (WG 4) • Marine Ecosystem Change (WG 5) • Ecosystem Services (WG 6) • In Situ / Remote Sensing Integration Through Modelling (WG 7) • Data Integration and Interoperability (WG 8) • (http://www.earthobservations.org/geobon.shtml)
Some Key Points • Open data policies are required! Without them, this global observation system cannot work. • Bottom Up & Top Down Observations; Modeling All the Way Across • It’s imperative to link people from the remote sensing and biodiversity research and conservation communities for this “top down” and “bottom up” approach to succeed. They must work together to build the network. • Simplify, Simplify, Simplify (i.e., for global efforts pick a few sample taxa and biome/ecosystem types at outset; sampling is ok) • There’s More than Enough Work to Go AroundPartnerships • Move Out on All Fronts at Once = Do What We Can Now for Assessments, Monitoring, Models • Calibration and validation of all datasets are vital. • In some cases, we can take advantage of well-characterized biodiversity sites for cal/val of imagery products and also use this as a rationale for establishing more sites (e.g.: a network of biodiversity supersites?). • Global Reference Frame required • Involve Governments or Perish—but not just Governments • Use the Web and Web Tools (for Data access) as well as to Multiply Arms and Legs (and Public Support!) through Citizen Science
Let’s Get Started • The pieces appear to be there: • Work with GEO BON to support framework • Connect with GEO High Resolution Land Cover Group (USGS/Tom Loveland and Wageningen/Martin Herold) to understand product and imprint biodiversity needs on it • Work with ZSL on the potential application of the LPI • Develop the BII (or another index) as a global tool integrating species population data and remotely-sensed ecosystem condition • Consider funding sources for a global observation system • Community Support is vital. • Unveil plans for global monitoring system at the World Conservation Congress in 2012 or Earth Summit 2012? • Be bold! We Can Do This!
Thank You!If you’re interested in discussing this topic, please come to this Team’s Open Forum tomorrow at 3:45PM.