Download
1 / 22
250 likes | 450 Vues
Implementation of a Visual Attention Model. Based on Itti, Koch and Niebur’s “ A Model of Saliency-Based Visual Attention for Rapid Scene Analysis ” IEEE PAMI 1998. Overview. Review of last presentation Details about individual steps Preprocessing Feature Maps Saliency Map

E N D
Implementation of a Visual Attention Model Based on Itti, Koch and Niebur’s “A Model of Saliency-Based Visual Attention for Rapid Scene Analysis” IEEE PAMI 1998
Overview • Review of last presentation • Details about individual steps • Preprocessing • Feature Maps • Saliency Map • Shifting Attention • Analysis of the model and performance
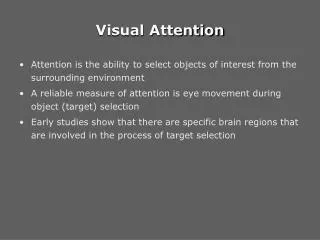
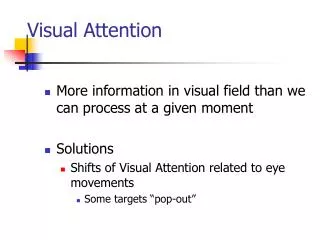
Review • Modelling the path of the focus of attention (FOA)
Preprocessing • Original image with red, green, blue channels • Intensity as I = (r + g + b)/3 • Broadly tuned color channels • R = r - (g + b)/2 • G = g - (r + b)/2 • B = b - (r + g)/2 • Y = (r + g)/2 - |r – g|/2 - b
Preprocessing r, g, b R, G, B, Y Itti, “Models of Bottom-Up and Top-Down Visual Attention” 2000
Preprocessing Intensity R G B Y
Multi resolution + Pyramids • Repeated low-pass filtering • W is the convolution kernel (Gaussian shape, s not stated) G3 32 x 32 G2 64 x 64 G1 128 x 128 G0 256 x 256
Multi resolution + Pyramids • Achieve centre-surround difference through across-scale difference • Denoted by Q • Performed by interpolating courser scale • Create one pyramid for each channelI(s), R(s), G(s), B(s), Y(s)where sÎ [0..8] is the scale
Intensity Feature Maps • I(c, s) = | I(c)QI(s)| • cÎ {2, 3, 4} • s = c + d where dÎ {3, 4} • So I(2, 5) = | I(2) QI(5)|I(2, 6) = | I(2) QI(6)|I(3, 6) = | I(3) QI(6)| … • 6 Feature Maps
Colour Feature Maps • Similar to double-opponent cells (Prim. V. C) • Red-Green and Yellow-Blue • RG(c, s) = | (R(c) - G(c)) Q (G(s) - R(s)) | • BY(c, s) = | (B(c) - Y(c)) Q (Y(s) - B(s)) | • Same c and s as with intensity +R-G +G-R +B-Y +Y-B +G-R +R-G +Y-B +B-Y
Orientation Feature Maps • Create Gabor pyramids for q = {0º, 45º, 90º, 135º} • c and s again similar to intensity
Normalization Operator • Promotes maps with few strong peaks • Surpresses maps with many comparable peaks • Normalization of map to range [0…M] • Find all local maxima • Find average m of all local maxima without the global maximum M • Multiply the map by (M – m)2
Saliency Map • Average all conspicuity maps
Neural layers S • Saliency Map (SM) modeled as layer of leaky integrate-and-fire neurons • SM feeds into winner-take-all (WTA) neural network • Inhibition of Return as transient inhibition of SM at FOA(can have DOG shape) + - SM Inhibition of Return + WTA FOA shifted to position of winner
Example a – Salient input location b – Location with half the saliency of a Itti, “Models of Bottom-Up and Top-Down Visual Attention” 2000
Analysis • Perform analysis on multiple images • Magazine covers, advertisements • Try to find images where method fails • If time permits • Compare multiscale method to maintaining resolution but increasing variance of Gaussian (no interpolation) • Compare original method to method without multiscale feature maps
Summary • Model can be broken down into main steps • Create pyramids for 5 channels of original image • Determine feature maps then conspicuity maps • Combine into saliency map (after normalizing) • Use two layers of neurons to model shifting attention • Plan to evaluate performance • Study model by modifying parts of implementation and comparing results
References Engel, Zhang and Wandell: “Colour tuning in human visual cortex measured with functional magnetic resonance imaging”Nature, vol. 388, no. 6,637, pp. 68-71(July 1997) Greenspan, Belongie, Goodman, Perona, Rakshit and Anderson: “Overcomplete Steerable Pyramid Filters and Rotation Invariance”Proc. IEEE Computer Vision and Pattern Recognition, pp. 222-228, Seattle Washington (June 1994) Itti: “Models of Bottom-Up and Top-Down Visual Attention”PhD Thesis, California Institute of Technology, Pasadena California (2000) Itti, Koch, and Niebur: “A Model of Saliency-Based Visual Attention for Rapid Scene Analysis”IEEE PAMI Vol. 20, No. 11, November (1998) Itti, Koch: “Computational Modeling of Visual Attention”Nature Reviews – Neuroscience Vol. 2 (2001) Parkhurst, Law, Niebur: “Modeling the role of salience in the allocation of overt visual attention”Vision Research 42 (2002) Tsotsos, Culhane, Wai, Lai, Davis and Nuflo: “Modelling Visual Attention via Selective Tuning” Artificial Intelligence, vol. 78, no. 1-2, pp. 507-545, (Oct. 1995)