Download
1 / 18
240 likes | 739 Vues
Reduction of Blood Culture Contamination Rates at UVRMC. Anna Marie White June 27, 2013. Team Members:. Dr. Paul Urie MD, PhD Michael J. Smith BS, MT(ASCP) Anna Marie White BS, MT(ASCP) Linda Bloomfield, Phlebotomy Supervisor Michael W. Nielson, Research

E N D
Reduction of Blood Culture Contamination Rates at UVRMC Anna Marie White June 27, 2013
Team Members: Dr. Paul Urie MD, PhD Michael J. Smith BS, MT(ASCP) Anna Marie White BS, MT(ASCP) Linda Bloomfield, Phlebotomy Supervisor Michael W. Nielson, Research IP and OP Phlebotomy Teams at UVRMC
Mission Statement: • Contaminated Blood Cultures are a serious form of medical waste. They increase healthcare costs, and they are preventable. • These false positive results lead to unnecessary admissions, extended hospital stays, inappropriate treatments, and distract clinicians from correct diagnoses and delays appropriate care. • In addition to the monetary impacts, it is our goal to reduce the emotional toll on patients and their families believing they may be facing a potential systemic infection, and reducing the time separated from their families and their lives
Background • BCX contamination rates are continuously monitored as standard Laboratory Quality Assurance, they are currently part of the Laboratory Services “Dashboard” measures • American Society of Microbiology (ASM) standard is currently 3.0 percent rate of contamination • UVRMC rates hovers around this standard, and periodically exceed this guideline. • BCX specimens are collected by both Nursing and Phlebotomy staff.
Background (cont.) • April 23, 2012 complaint from patient’s father to Patient Relations, daughter was admitted to Peds. because of Positive BCX drawn in UV Out-Patient Lab. Later told by physician it was a false positive due to contamination. Family incurred nearly $4000.00 in unnecessary medical costs due to that admission • “We can no longer deny this is a phlebotomy issue” • Questions? • What are TRUE contamination rates by Phlebotomist and unit? • How do we compare to our sister facilities? • What is in the literature?
BCX Contamination Rates by Individual Phlebotomist (May 2012 to June 2013)
Average BCX Contamination Rates by Unit and Lab (Compare 12 Month Avg. Jun 2011-12 and Jun 2012-13)
12-month BCX contamination rates for UVRMC and Intermountain ‘like-sized’ hospitals and IMC
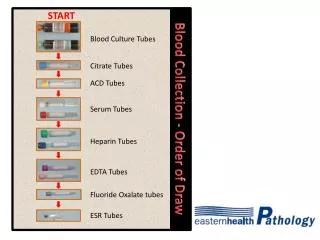
Suggestions from Literature: • Ensure adequate activation/drying time of disinfectant • Reduce or Eliminate Re-palpation • Eliminate “Line Collections” except to rule-out infected lines • No Blood Culture Collection from IV starts
Targeted interventions suggested by Team: • Stay informed and maintain awareness • Discussed individual patient impact • “We want to know our personal rates” • Share “Best Practices” • Reward for “Best Practices” • Discuss “Drying Time” vs. Activation Time (30 seconds) • Re-palpation—How can we avoid this? • Surgical Marking pens • Only when absolutely necessary, ensure gloved finger is disinfected with identical process. • SOP does not include cleansing procedure for product we are currently using at UVRMC- Review manufacturers suggested process.
Where do we go from here: • Maintain continued awareness keep Phlebotomy Teams informed and vigilant. • Monthly updates of Individual Rates • Monthly updates, where we stand against “Sister” Facilities • Reward Successes • Use best performers to train best practices • Work with Nursing Education to reduce line draws • Emergency Department—High Risk IV Start Collections
Intervention #2: Monthly personal e-mail with rate and where they stand among their peers.
REFERENCES: • Paxton, Ann “Contaminated blood cultures: taking bold steps to lower rates.” CAP Today 1 April 2012 Published: Page 1. Print. • Marini, Michelle A., MSN, RN, CPNP, CPEN, Truog, Amy W., BSN, RN, CPEN, “Reducing False-Positive Peripheral Blood Cultures in a Pediatric Emergency Department.” www.jenonline.org2011 • GE Ying, LIU Xiao-qing, XU Ying-chun, XU Shan, YU Ming-hong, ZHANG Wei, DENG Guo-hua “Blood collection procedures influence contamination rates in blood culture: a prospective study.” Chin Med J 2011; 123(23): 4002-4006 • CLSI Procedures for the Collection of Diagnostic Blood Specimens by Venipuncture-Fifth Edition, Approved Gideline H3-A5, Wayne, PA: Clinical and Laboratory Standards Institute, 2003