Download
1 / 24
240 likes | 441 Vues
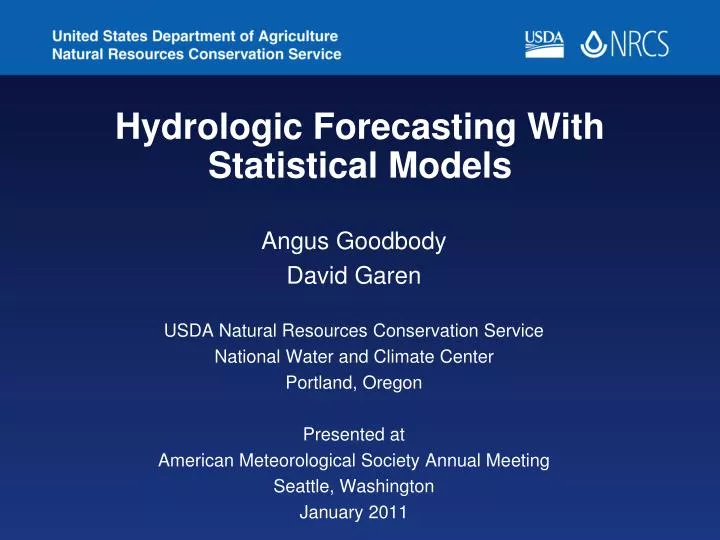
Hydrologic Forecasting With Statistical Models. Angus Goodbody David Garen USDA Natural Resources Conservation Service National Water and Climate Center Portland, Oregon Presented at American Meteorological Society Annual Meeting Seattle, Washington January 2011.

E N D
Hydrologic Forecasting WithStatistical Models Angus Goodbody David Garen USDA Natural Resources Conservation Service National Water and Climate Center Portland, Oregon Presented at American Meteorological Society Annual Meeting Seattle, Washington January 2011
Snow Survey andWater Supply Forecasting Program • Data collection • Water supply forecasts • Climate services
SNOTEL Network Currently over 800 sites in 13 western states http://www.wcc.nrcs.usda.gov/snow
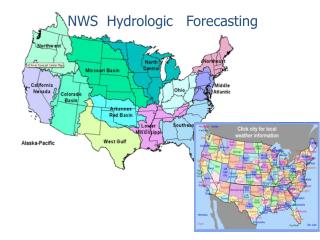
Water Supply Forecasting • Seasonal streamflow volume • Published January through June • Cooperative effort with National Weather Service • Over 700 forecast points in western US
Hydroclimatic Regime Issues • Yellowstone: snowmelt dominant • Big Thompson: snowmelt + spring precip • Salt: minor snowmelt + monsoon • Santiam: winter rain dominant
Statistical Modeling: Techniques • Regression models: Principal components or Z-score • Optimization: Time period and variable search • Jackknife (cross-validation) test • Linear or transformed target variable
Statistical Modeling: Standard Data • SNOTEL: SWE, precipitation, temperature • Snowcourse: SWE • NWS cooperative network: precipitation • USGS: streamflow • Climate teleconnection indices
Model Building Philosophy • Robust models • Month-to-month consistency • Physically meaningful and explainable • Statistically valid • Operationally useful
Forecast Uncertainty • Usual regression assumptions of homoscedasticity and normal distribution of errors • Forecast is interpreted as a conditional probability distribution • NRCS publishes five values at different exceedance levels (90, 70, 50, 30, 10%)
Forecast Uncertainty ================================================================================ UPPER JOHN DAY BASIN Streamflow Forecasts - January 1, 2011 ================================================================================ | <=== Drier === Future Conditions === Wetter ===> | | | Forecast Pt | ============== Chance of Exceeding * ============== | Forecast | 90% 70% | 50% | 30% 10% | 30 Yr Avg Period |(1000AF) (1000AF)|(1000AF) (% AVG.)|(1000AF) (1000AF)| (1000AF) ================================================================================ MF John Day R at Ritter MAR-JUL 136 173 199 125 225 260 159 APR-SEP 106 138 160 125 182 215 128 NF John Day R at Monument MAR-JUL 695 870 990 125 1110 1280 790 APR-SEP 530 675 770 125 865 1010 615 ================================================================================
VIPER:Visual Interactive Prediction and Estimation Routines VIPER is our software environment containing all of the statistical algorithms that we employ plus equation management and operational forecasting utilities. VIPER is an Excel spreadsheet application with macros and with live web-based data retrieval from the NRCS-NWCC and USGS databases.
VIPER Main Interface Selecting predictors and predictands Global month changes
VIPER Main Interface Selecting predictors and predictands Global month changes Predictors quality, availability Historical statistics
VIPER Main Interface Selecting predictors and predictands Forecast vs observed time series Station availability, weights Global month changes Predictors quality, availability Historical statistics
VIPER Main Interface Selecting predictors and predictands Forecast vs observed time series Station availability, weights Global month changes Predictors quality, availability Fcst vs obs scatterplot Helper variable Scatterplot/ Forecast progression Historical statistics
VIPER Main Interface Selecting predictors and predictands Forecast vs observed time series Station availability, weights Global month changes Predictors quality, availability Fcst vs obs scatterplot Helper variable Scatterplot/ Forecast progression Settings Probability bounds Historical statistics
VIPER Main Interface And, off to the right, is a scatterplot and time series plot.
VIPER Main Interface Selecting the target and predictors -- closeup:
VIPER Station Optimization VIPER REGRESSION COMBINATION OPTIMIZATION SUMMARY OUTPUT Number of combinations evaluated = 727 Created on 1/12/2011 10:43:11 AM by dgaren Transformation type: None Analysis type: Principal Components VARIABLES: Y114046000,APR-SEP,SRVO,USGS,OR,USGS,N. F. John Day At Monument X1304,JAN,WTEQ,SNTL,OR,AWDB,ArbuckleMtn X2361,JAN,WTEQ,SNTL,OR,AWDB,Bourne X4494,JAN,WTEQ,SNTL,OR,AWDB,Gold Center X5605,JAN,WTEQ,SNTL,OR,AWDB,Lucky Strike X6608,JAN,WTEQ,SNTL,OR,AWDB,Madison Butte X7821,JAN,WTEQ,SNTL,OR,AWDB,Tipton X9304,OCT-DEC,PRCP,SNTL,OR,AWDB,ArbuckleMtn X10361,OCT-DEC,PRCP,SNTL,OR,AWDB,Bourne X12494,OCT-DEC,PRCP,SNTL,OR,AWDB,Gold Center X13605,OCT-DEC,PRCP,SNTL,OR,AWDB,Lucky Strike X14608,OCT-DEC,PRCP,SNTL,OR,AWDB,Madison Butte X15821,OCT-DEC,PRCP,SNTL,OR,AWDB,Tipton X17TNI,JUL-NOV,OI,CLMIND,NA,AWDB,Tni Climate Index
VIPER Station Optimization EQUATION SUMMARY: RANK VARIABLES JACKKNIFE JACK. NUM. 1 1 1 1 1 1 1 1 1 1 2 2 2 2 2 2 2 2 2 2 3 STANDARD CORR. OBS. NUM. 1 2 3 4 5 6 7 8 9 0 1 2 3 4 5 6 7 8 9 0 1 2 3 4 5 6 7 8 9 0 ERROR COEF. USED PC'S 1 X X X 156.567 0.753 29 1 2 X X X X X 160.246 0.751 29 2 3 X X X X X 161.365 0.747 29 2 4 X X X X X 161.641 0.746 29 2 5 X X X X X X 161.795 0.745 29 2 6 X X X X X 162.049 0.744 29 2 7 X X X X X X 162.053 0.745 29 2 8 X X X X 162.194 0.732 29 1 9 X X X X 162.247 0.731 29 1 10 X X X X 162.415 0.731 29 1 11 X X X X 162.505 0.730 29 1 12 X X X X X 162.570 0.731 29 1 13 X X X X X 162.664 0.742 29 2 14 X X X X 162.678 0.730 29 1 15 X X X X X 163.013 0.741 29 2 16 X X X X X X X 163.023 0.741 29 2 17 X X X X X 163.123 0.741 29 2 18 X X X X X X 163.148 0.740 29 2 19 X X X X X X 163.207 0.740 29 2 20 X X X X X X 163.364 0.740 29 2
Examples of Equation Development Colorado River John Day River Remainder of presentation is a live demo ...