Download
1 / 15
150 likes | 164 Vues
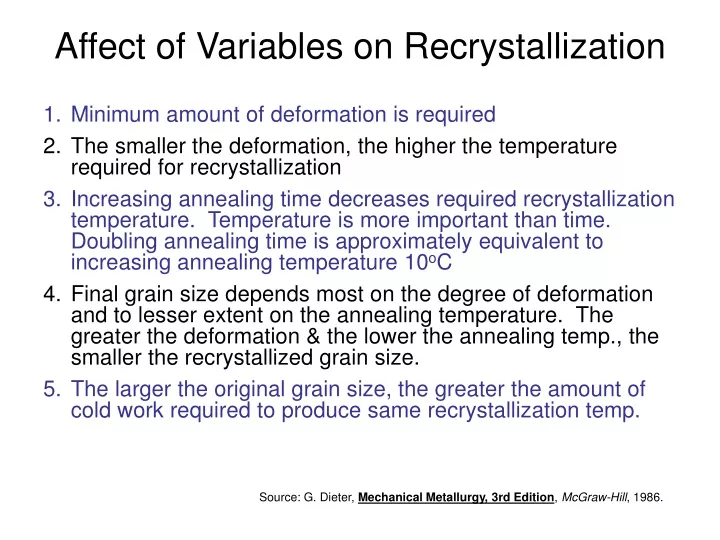
Affect of Variables on Recrystallization. Minimum amount of deformation is required The smaller the deformation, the higher the temperature required for recrystallization

E N D
Affect of Variables on Recrystallization • Minimum amount of deformation is required • The smaller the deformation, the higher the temperature required for recrystallization • Increasing annealing time decreases required recrystallization temperature. Temperature is more important than time. Doubling annealing time is approximately equivalent to increasing annealing temperature 10oC • Final grain size depends most on the degree of deformation and to lesser extent on the annealing temperature. The greater the deformation & the lower the annealing temp., the smaller the recrystallized grain size. • The larger the original grain size, the greater the amount of cold work required to produce same recrystallization temp. Source: G. Dieter, Mechanical Metallurgy, 3rd Edition, McGraw-Hill, 1986.
Affect of Variables on Recrystallization • The recrystallization temperature decreases with increasing purity of the metal. Solid solution alloying additions ALWAYS raise the recrystallization temperature. • The amount of deformation required to produce equivalent recrystallization behavior increases with increased working temperature • For a given reduction in cross-section – different metal working processes produce different effective deformations. Therefore, identical recrystallization behavior may not be obtained. Source: G. Dieter, Mechanical Metallurgy, 3rd Edition, McGraw-Hill, 1986.
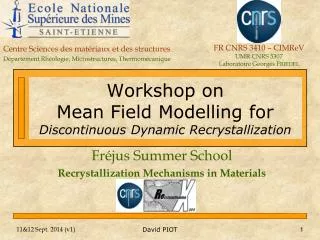
Grain Growth • If you expose any crystalline material to a high enough temperature to allow diffusivity and atomic mobility then you will have grain growth. • Specifically, the average grain size will increase with time at temperature Movie http://www.albany.edu/geosciences/wdm/wdmoviep.html • Why? Grain boundary area (and therefore energy) is reduced
Grain Growth – How does it occur 0.6 mm 0.6 mm After 8 s, 580ºC After 15 min, 580ºC Grain size is the mean diameter of an aggregate of grains As grains grow the number of grains decreases but the mean diameter continues to grow • Larger grains consume smaller ones. • Grain boundaries have curvature • Migration of atoms across grain boundaries always moves toward the center of curvature • Small grains that are not hexagonal and have corners at angles less than 120o (a perfect hexagon has 120o) tend to have center of curvature towards center of grain – they shrink • Big grains, or grains with more than 6 sides grow
coefficient dependent on material and T. exponent typ. ~ 2 elapsed time grain diam. at time t. Mathematical Relationships Empirical Relationship: • Most reported experimental work does not conform to grain growth equation • Many of the data sets correspond to empirical equation of the form • D = ktn • Where • n is less than value ½ • n is not usually constant for given metal or alloy with changes in T Source: Reed-Hill & Abbaschian, Physical Metallurgy Principles, 3rd Edition, PWS Publishing Company, 1994.
Definitions • Component: Pure metal or compound from which an alloy is composed • Components are Zn and Cu in Brass Diagram • We have also used the terms solvent and solute when we were discussing solid solutions • Phase: A homogeneous portion of a system that has uniform physical and chemical characteristics • Every pure metal is a phase • Every liquid, solid, or gaseous solution is a phase • When two or more phases are present there is a boundary between the two • Phase diagram: is a graphical representation of phase stability • Phase stability is dependent on temperature, pressure, and composition • Phase diagrams are constructed to show the interplay of these parameters
Solution thermodynamics can be used to derive phase diagrams – not gonna happen here. Definition of Equilibrium • Definition of Gibb’s Free Energy, DG: DG = DH – TDS DG = DGo – RTlnQ • Gibb’s Free Energy is used to determine if a reaction will occur – must be negative • At equilibrium – DG = 0, reaction rates forward and backward are equal • Phase equilibrium is stability in the chemical and physical makeup of phases present with time
One Component Phase Diagram Curves represent chemical reaction that describes a phase transformation Gibbs Phase Rule: P + F = C + 2 P: Number of Phases F: Degrees of Freedom (What variables may be independently changed without altering state of system) C: Number of Components Invariant point – no degrees of freedom Beyond “critical point” physico-chemical properties of water and steam converge to the point where they are identical. Beyond the critical point: "supercritical fluid". Water phase diagram can be used to explain ice skating…
Sucrose/Water Phase Diagram 10 0 Solubility L Limit 8 0 (liquid) 6 0 + L Temperature (°C) S (liquid solution 4 0 i.e., syrup) (solid 20 sugar) 0 20 40 60 80 100 65 Co =Composition (wt% sugar) Sugar Water Pure Pure Definition of Solubility Limit • Solubility Limit: Max concentration for which only a single phase solution occurs. Question: What is the solubility limit at 20°C? Answer: 65 wt% sugar. If Co < 65 wt% sugar: syrup If Co > 65 wt% sugar: syrup + sugar.
B (100°C,70) 1 phase D (100°C,90) 2 phases 100 L 80 (liquid) + 60 L S Temperature (°C) ( liquid solution (solid 40 i.e., syrup) sugar) A (20°C,70) 2 phases 20 0 0 20 40 60 70 80 100 Co =Composition (wt% sugar) Effect of T & Composition (Co) path A to B. • Changing T can change # of phases: • Changing Co can change # of phases: path B to D. water- sugar system Adapted from Fig. 9.1, Callister 7e.
Binary Phase Diagram • Hold pressure constant (typically 1 atm) • Allow temperature and composition to vary • Binary phase diagram has 2 components • Ternary phase diagram has 3 components (not going to cover in this class) • Maps of equilibrium phase structures
Fully Miscible Solution Simple solution system (e.g., Ni-Cu solution) • Both have the same crystal structure (FCC) and have similar electronegativities and atomic radii (W. Hume – Rothery rules) suggesting high mutual solubility. • Ni and Cu are totally miscible at all mixture compositions – isomorphous
Copper-Nickel Binary Equilibrium Phase Diagram • Solid solutions are typically designated by lower case Greek letters: a, B, g, etc. • Liquidus line separates liquid from two phase field • Solidus line separates two phase field from a solid solution • Pure metals have melting points • Alloys have melting ranges What do we have? What’s the composition?