Download
1 / 21
300 likes | 876 Vues
Black-Litterman Model. An Alternative to the Markowitz Asset Allocation Model. Allen Chen Pui Wah (Emily) Tsui Patrick Peng Xu. What is the Black- Litterman Model?. The Black-Litterman Model is used to determine optimal asset allocation in a portfolio

E N D
Black-Litterman Model An Alternative to the Markowitz Asset Allocation Model Allen Chen Pui Wah (Emily) Tsui Patrick Peng Xu
What is the Black-Litterman Model? • The Black-Litterman Model is used to determine optimal asset allocation in a portfolio • Black-Litterman Model takes the Markowitz Model one step further • Incorporates an investor’s own views in determining asset allocations
Two Key Assumptions • Asset returns are normally distributed • Different distributions could be used, but using normal is the simplest • Variance of the prior and the conditional distributions about the true mean are known • Actual true mean returns are not known
Basic Idea • Find implied returns • Formulate investor views • Determine what the expected returns are • Find the asset allocation for the optimal portfolio
Implied vs. Historical Returns • Analogous to implied volatility • CAPM is assumed to be the true price such that given market data, implied return can be calculated • Implied return will not be the same as historical return
Bayesian Theory • Traditionally, personal views are used for the prior distribution • Then observed data is used to generate a posterior distribution • The Black-Litterman Model assumes implied returns as the prior distribution and personal views alter it
Expected Returns E(R) = [(τ Σ)-1 + PT ΩP]-1 [(τ Σ)-1 Π + PT ΩQ] • Assuming there are N-assets in the portfolio, this formula computes E(R), the expected new return. • τ = A scalar number indicating the uncertainty of the CAPM distribution (0.025-0.05)
Expected Returns: Inputs Π= δ Σ wmkt • Π = The equilibrium risk premium over the risk free rate (Nx1 vector) • δ = (E(r) – rf)/σ2 , risk aversion coefficient • Σ = A covariance matrix of the assets (NxN matrix)
Expected Returns: Inputs • P = A matrix with investors views; each row a specific view of the market and each entry of the row represents the portfolio weights of each assets (KxN matrix) • Ω = A diagonal covariance matrix with entries of the uncertainty within each view (KxK matrix) • Q = The expected returns of the portfolios from the views described in matrix P (Kx1 vector)
Breaking down the views • Asset A has an absolute return of 5% • Asset B will outperform Asset C by 1% • Omega is the covariance matrix
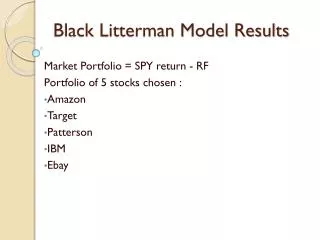
Example 1 • Using Black-Litterman model to determine asset allocation of 12 sectors • View: Energy Sector will outperform Manufacturing by 10% with a variance of .025^2 • 67% of the time, Energy will outperform Manufacturing by 7.5 to 12.5%
Complications • Assets by sectors • We did not observe major differences between BL asset allocation given a view and market equilibrium weights • Inconsistent model was difficult to analyze • There should have been an increase in weight of Energy and decrease in Manufacturing
Example 2Model in Practice • Example illustrated in Goldman Sachs paper • Determine weights for countries • View: Germany will outperform the rest of Europe by 5%
Statistical Analysis Country Metrics Covariance Matrix
Traditional Markowitz Model Portfolio Asset Allocation Expected Returns
Black-Litterman Model Portfolio Asset Allocation Expected Returns
Advantages and Disadvantages • Advantages • Investor’s can insert their view • Control over the confidence level of views • More intuitive interpretation, less extreme shifts in portfolio weights • Disadvantages • Black-Litterman model does not give the best possible portfolio, merely the best portfolio given the views stated • As with any model, sensitive to assumptions • Model assumes that views are independent of each other
Conclusion • Further Developments Table obtained from http://blacklitterman.org/methods.html
Bibliography • Black, F. and Litterman, R. (1991). “Global Asset Allocation with Equities, Bonds, and Currencies.” Fixed Income Research, Goldman, Sachs & Company, October. • He, G. and Litterman, R. (1999). “The Intuition Behind Black-Litterman Model Portfolios.” Investment Management Research, Goldman, Sachs & Company, December. • Black, Fischer and Robert Litterman, “Asset Allocation: Combining Investor Views With Market Equilibrium.” Goldman, Sachs & Co., Fixed Income Research, September 1990. • Idzorek, Thomas M. “A Step-by-Step Guide to the Black-Litterman Model.” Zehyr Associates, Inc. July, 2004. • Satchell, S. and Scowcroft, A. (2000). “A Demystification of the Black-Litterman Model: Managing Quantitative and Traditional Construction.” Journal of Asset Management, September, 138-150.