Download
1 / 34
340 likes | 554 Vues
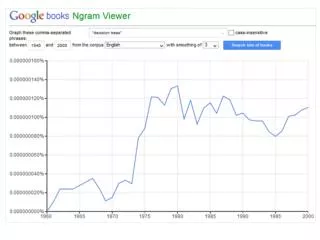
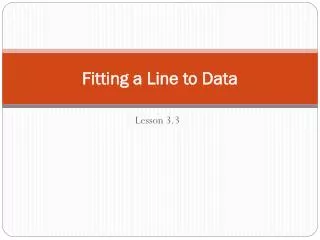
Fitting the HiRes Data. Douglas Bergman Rutgers University 28 April 2005. The HiRes Data. Here’s the HiRes spectra. The HiRes Data. Here’s the HiRes spectra Actually fit to numbers of events using calculated aperture Use binned maximum likelihood method

E N D
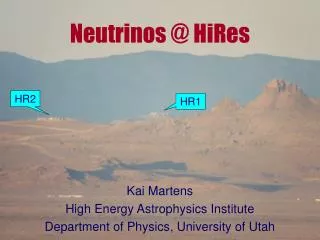
Fitting the HiRes Data Douglas Bergman Rutgers University 28 April 2005
The HiRes Data • Here’s the HiRes spectra Aspen Workshop
The HiRes Data • Here’s the HiRes spectra • Actually fit to numbers of events using calculated aperture • Use binned maximum likelihood method • Two empty bins for each of HiRes-I and HiRes-II Aspen Workshop
c2 = 114/37 g = -3.12(1) Features • What are the features of the spectrum? • Fit to broken power law • No BP, bad fit Aspen Workshop
c2 = 46.0/35 g1= -3.31(3) log10E = 18.45(2) g2= -2.91(3) Features • What are the features of the spectrum? • Fit to broken power law • No BP, bad fit • 1 BP, Ankle Aspen Workshop
c2 = 30.1/33 g1= -3.32(4) log10E12 = 18.47(6) g2= -2.86(4) log10E23 = 19.79(9) g3= -5(1) Features • What are the features of the spectrum? • Fit to broken power law • No BP, bad fit • 1 BP, Ankle • 2 BP, HE suppression • 11 events above break • Expect 28 with red line • Poisson prob. 2.4x10⁻⁴ • Is the HE suppression the GZK? Aspen Workshop
Integral Spectra • One measure of the energy of the suppression is E½ • Due to Berezinsky • Where integral flux is half of expected with no suppression Aspen Workshop
Integral Spectra • One measure of the energy of the suppression is E½ • Due to Berezinsky • Where integral flux is half of expected with no suppression • Use red line extension of broken power law as no-suppression expectation Aspen Workshop
Integral Spectra • One measure of the energy of the suppression is E½ • Due to Berezinsky • Where integral flux is half of expected with no suppression • Use red line extension of broken power law as no-suppression expectation • Find log10E½ = 19.77+0.15-0.06 • Berezinsky et al, predict log10E½ = 19.72 for the GZK Aspen Workshop
The HiRes Data (again) • Want to fit the HiRes spectra… Aspen Workshop
The HiRes Data (again) • Want to fit the HiRes spectra… • And also take into account the HiRes composition measurements QGSJet protons QGSJet Iron Aspen Workshop
The HiRes Data (again) • Want to fit the HiRes spectra… • And also take into account the HiRes composition measurements • Make one simplifying assumption: • Composition determines origin • Iron is Galactic • Protons are Extragalactic • Use fit to composition • But assume all protons at 100 EeV • Fit spectrum by varying extragalactic model, galactic spectrum determined from this “Toy Model” assumption Aspen Workshop
Uniform Source Model (XG) • Assume uniform sources of extragalactic protons • Identical spectral slope g • Uniform luminosity density at any epoch • Luminosity density can vary as (1+z)m • Protons lose energy • Average energy loss rate from Berezinsky et al Aspen Workshop
Uniform Source Model (XG) • Assume uniform sources of extragalactic protons • Identical spectral slope g • Uniform luminosity density at any epoch • Luminosity density can vary as (1+z)m • Protons lose energy • Average energy loss rate from Berezinsky et al • Pion production causes proton to loose a large fraction of its energy • Have to use MC for this process Aspen Workshop
Uniform Source Model (XG) Z=0.0004 Aspen Workshop
Uniform Source Model (XG) Z=0.001 Aspen Workshop
Uniform Source Model (XG) Z=0.004 Aspen Workshop
Uniform Source Model (XG) Z=0.01 Aspen Workshop
Uniform Source Model (XG) Z=0.04 Aspen Workshop
Uniform Source Model (XG) Z=0.1 Aspen Workshop
Uniform Source Model (XG) Z=0.4 Aspen Workshop
Uniform Source Model (XG) Z=1 Aspen Workshop
Uniform Source Model (XG) Z=4 Aspen Workshop
Uniform Source Model (XG) • All the shells together • g = 2.4 • m = 2.5 • Each energy dominated by different range in z • Given energy is somewhat flat in z up to maximum • Allows one to do cosmology Aspen Workshop
Uniform Source Model (XG) • All the shells together • g = 2.4 • m = 2.5 • Each energy dominated by different range in z • Given energy is somewhat flat in z up to maximum • Allows one to do cosmology • Sum of shells gives spectrum for fitting Aspen Workshop
Uniform Source Model (XG) • All the shells together • g = 2.4 • m = 2.5 • Each energy dominated by different range in z • Given energy is somewhat flat in z up to maximum • Allows one to do cosmology • Sum of shells gives spectrum for fitting • Actually need finer set of shells Aspen Workshop
Best USM Fit to HiRes • Fit USM varying m and g • g = 2.38 • m = 2.55 • Galactic spectrum falls steeply above 100 PeV Extragalactic Galactic Aspen Workshop
Best USM Fit to HiRes c2 Contours for Spectrum Fit • Fit USM varying m and g • g = 2.38 • m = 2.55 • Galactic spectrum falls steeply above 100 PeV • Statistical Uncertainty • g = 0.035 • m = 0.25 Aspen Workshop
Best USM Fit to HiRes c2 Contours for Spectrum Fit • Fit USM varying m and g • g = 2.38 • m = 2.55 • Galactic spectrum falls steeply above 100 PeV • Statistical Uncertainty • g = 0.035 • m = 0.25 • Systematic Uncertainty • g = 0.03 • m = 0.3 Aspen Workshop
Where the Fit Works Well… • The fit works best in the Ankle region • Understand the Ankle as coming from e+e- pair production energy losses • Spectral slope (g) mostly determined by rise from Ankle (HiRes-I dominates) • Evolution (m) determined by fall into Ankle (HiRes-II dominates) Extragalactic Galactic Aspen Workshop
…and Where it Doesn’t • GZK region • Fit is above the data • Perhaps… • Some sources have Emax of order GZK threshold • 2nd Knee Region • There isn’t one • Perhaps… • The input spectral slope changes? • Evolution of sources changes? Extragalactic Galactic Aspen Workshop
Spectrum Overview Aspen Workshop
Spectrum Overview Aspen Workshop
Conclusion • HiRes has measured the UHECR spectrum from 1017.2 eV to just above 1020 eV • HiRes Prototype/MIA and HiRes Stereo have measured the <Xmax> of UHECR from 1016.9 eV to 1019.4 eV • Broken power law fit to spectrum finds the Ankle at 1018.5 eV and evidence for a suppression at 1019.8 eV • HE suppression found consistent with being the GZK by examining integral spectrum • We have used the composition measurements to separate the galactic and extragalactic components of the spectrum and fit the extragalactic component to a uniform source model with variable evolution and with proton energy losses Aspen Workshop