Download
1 / 39
390 likes | 397 Vues
PreVOCA: How Well Can We Forecast Subtropical Stratocumulus with Regional and Global Models?. Matt Wyant Rob Wood Chris Bretherton Roberto Mechoso with help from participating modeling groups, Dave Leon (U Wyo), Rhea George (UW). Outline. Introduction to VOCALS and PreVOCA

E N D
PreVOCA: How Well Can We Forecast Subtropical Stratocumulus with Regional and Global Models? Matt Wyant Rob Wood Chris Bretherton Roberto Mechoso with help from participating modeling groups, Dave Leon (U Wyo), Rhea George (UW)
Outline • Introduction to VOCALS and PreVOCA • PreVOCA Experiment Setup • Comparison of Mean Cloud and PBL Structure • Comparison of Diurnal Cycle • Conclusions and Future Directions
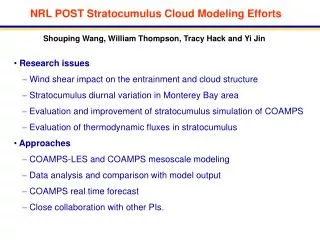
VOCALS The VAMOS Ocean-Cloud-Atmosphere-Land Study • A multiyear study of boundary layer cloud, aerosol, and upper ocean heat/constituent transport • WHOI stratus flux-reference buoy at 20S 85W (2000+) • Annual instrumented cruises in austral spring (starting with EPIC 2001 stratocumulus cruise). • Regional Experiment (REx) in Oct.-Nov. 2008, including 4 aircraft based in northern Chile, two ships, coastal site • Satellite data analysis of cloud properties • Atmosphere and ocean modeling (LES to global).
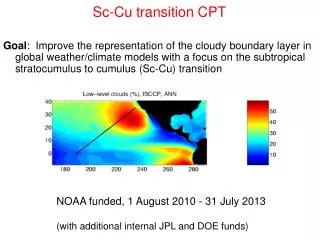
Southeast Pacific Climate - A Modeling Challenge World’s most persistent subtropical low cloud regime. MODIS cloud droplet conc. SST, clouds poorly simulated by GCMs Cloud-aerosol interaction
PreVOCA GOAL: Assess the forecast skill and biases of global/ regional model simulations of SE Pacific boundary-layer clouds and aerosols on diurnal and longer timescales. WHAT? Daily hindcasts for October 2006 over the SE Pacific. WHY? Learn how to optimally use Rex (Oct-Nov 2008), satellite and cruise data for model assessment and improvement. WHO? 14 modeling groups using regional and global models, including climate models run in forecast mode. WHEN? Data submission is complete; analysis in progress, journal submission early 2009. www.atmos.washington.edu/~robwood/PreVOCA/index.html
Modeling Challenges: How well can climate, forecast and regional models predict… • Cloud type/boundary layer structure • Cloud thickness/cloud fraction • Aerosol concentration • Mesoscale cloud features (POCS)
Pockets of Open Cells (POCs) 200 km
Simulated cellular convection (Savic-Jovcic and Stevens 2008, JAS) Albedo
Pre-VOCA Experiment Setup • For each model generate a collection of October 2006 forecasts (typically daily) • Initialize from forecast analysis (typically NCEP or ECMWF) • Specify SST • Primary domain is 0 - 40 S, 70-110 W • Archive 3-hourly data • Results submitted throughout 2008
Why Forecast Mode? • Many model biases show up quickly (e.g. Phillips et al. 2004, Hannay et al 2008). • Analyze before large-scale fields drift too far from reality. • Analyze after model adjusts to initialization. • In GCM’s this method is especially helpful (and cheap!) in detecting cloud biases in situations where other model errors will compensate given enough time.
QuikSCAT winds [m s-1] October 2006 Means
10 1 0.1 0.01
NOAA ESRL 85W 20S October 2001-2007 Mean • Nearly adiabatic 100-300m thick cloud located at top of BL • Convection driven mainly by radiative cooling at cloud-top • Well-mixed or decoupled 1-2 km deep • Strong sharp inversion, steady subsidence • Very dry air above • Very little middle and high cloud • Weak cold advection in BL • Surface precipitation typically light • Cumulus rising into stratocumulus to west • Trade cumulus to northwest
Oct 2006 10 m vector wind (m s-1) - models agree fairly well Regional Global
Omega at 850 hPa (Pa s-1) - also not too bad Regional Global
20S 85W sounding comparisons Global forecast Climate Regional θ October soundings at IMET BUOY location qv
20S Cloud liquid water [g kg-1] UChile WRF COAMPS IPRC Obs pinv UKMO EC-oper NCEP
Diurnal Composite LWP TMI climo from Wood et al. (2002) GRL 18 12 24 6 0 Hour (local)
Diurnal Composite Low Cloud Fraction EECRA compiled by Sungsu Park 18 12 24 6 0 Hour (local)
w at 800hPa Modeled ‘Upsidence’ Wave November 14-28 2001 Garreaud and Munoz (2004) J. Climate
850hPa Omega composite, 20S 75 W 80 W 85 W Hour GMT
Conclusions from PreVOCA • Models produce similar large scale forcing in this region including subsidence waves off the Andes. • Much scatter in PBL/Sc properties, especially among the regional models: an issue for aerosol-cloud interaction? • UKMO and ECMWF models perform best overall, correctly capturing most geographic variations in PBL depth/structure and cloud cover. • Sharpness of inversion challenges even the highest-resolution models. • Most models simulate diurnal cycle of clouds with correct phase, though amplitudes are questionable in many cases. • We are still exploring the models’ cloud response to synoptic variability.
Conclusions (continued) • Cloud variability and aerosol feedbacks are cutting-edge challenges to the best global and regional models. • VOCALS SE Pacific datasets are wonderful tools for assessing and improving cloud and aerosol simulations.
From PreVOCA to VOCA... VOCA: Similar protocol to preVOCA using REx observations from 15 Oct -15 Nov 2008 More focus on chemical transport, aerosol concentrations and reff vs. in-situ and CALIPSO data. We will send out a detailed protocol early this year. All modeling groups are welcome (with or without chemical transport modeling capability).
Data from REx for Model Assessment • ~35 days of Ron Brown ship observations near 20S (cloud radar, scanning 5 cm radar, lidar, sondes, surface met/fluxes, aerosols, sulfur chemistry, oceanography) • Numerous night/day flights sampling 20S along 70-85W (aerosols, chemistry, cloud radar, dropsondes). NOAA Ronald H Brown UK BAe146 NSF C-130
Great cloud radar, microphysics, aerosol data RF03 Courtesy Dave Leon