Download
1 / 35
350 likes | 496 Vues
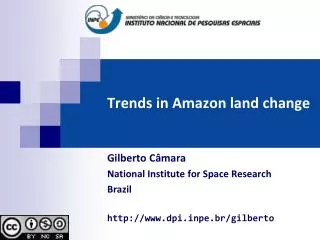
Planet Under Pressure 2012, London. Trends in Amazon land change and possible consequences for REDD+ . Gilberto Câmara National Institute for Space Research Brazil http :// www.dpi.inpe.br / gilberto. Can we build REDD+ without institutions?. Justice. Public health. Knowledge.

E N D
Planet UnderPressure2012, London Trends in Amazonlandchangeandpossibleconsequences for REDD+ Gilberto Câmara NationalInstitute for Space Research Brazil http://www.dpi.inpe.br/gilberto
Can we build REDD+ without institutions? Justice Public health Knowledge Information
The rôle of forests in global climate Aware that deforestation accounts for approximately 20% of annual CO2 emissions, we remain engaged in seeking the reduction of emissions from deforestation and forest degradation (REDD) (G8 L’Aquila Declaration, 2009)
The rôle of forests in global climate Aware that deforestation accounts for approximately 20% of annual CO2 emissions, we remain engaged in seeking the reduction of emissions from deforestation and forest degradation (REDD) (G8 L’Aquila Declaration, 2009) MYTH
10 8 Fossil fuel 6 CO2 emissions (PgC y-1) 4 Land use change 2 1970 1980 2010 2000 1960 1990 Global GHG emissions Land change < 10% of total GHG emissions in 2010 source: Global Land Project (2010)
REDD+: payments for avoided deforestation Growth in developing countries will produce emissions from deforestation
REDD+: payments for avoided deforestation MYTH Growth in developing countries will produce emissions from deforestation
Economic recovery and deforestation: 2001-2004 Yearly deforestation rate for 2003-2004: 27,100 km2
Economic growth without increased deforestation Deforestation in Brazilian Amazonia (1988-2011) dropped from 27,000 km2 to 6,200 km2
REDD+ can be built bottom-up Chief Almir and Suruí reserve
REDD+ can be built bottom-up MYTH Chief Almir and Suruí reserve
Amazonia: 400.000.000 ha Suruí reserve: 250.000 ha
Why developing countries need REDD+? Theycannotcontroltheirlands They do nothavemonitoringtechnology They do nothavetransparency
Why developing countries need REDD+? MYTH Theycannotcontroltheirlands They do nothavemonitoringtechnology They do nothavetransparency
How much it takes to survey Amazonia? 116-112 30 Tb of data 500.000 lines of code 150 man/years of software dev 200 man/years of interpreters 116-113 166-112
Real-time Deforestation Monitoring Daily warnings of newly deforested large areas
Policing actions: illegal wood seizure 50% ofoperations in 2% ofthearea
“By 2020, Brazilwillreducedeforestationby 80% relativeto 2005.” (pres. Lula in Copenhagen COP-15)
Transparency builds governance! Deforestation in Brazilian Amazonia (1988-2011) dropped from 27,000 km2 to 6,200 km2
Prices or policies? Deforestation Slowdown in the Legal Amazon: Prices or Policies? http://www. climatepolicyinitiative.org
Até 10% 10 - 20% 20 – 30% 30 – 40% 40 – 50% 50 – 60% 60 – 70% 70 – 80% 80 – 90% 90 – 100% Deforestation in Amazonia 700.000 km2 deforestedsince 1970s
Até 10% 10 - 20% 20 – 30% 30 – 40% 40 – 50% 50 – 60% 60 – 70% 70 – 80% 80 – 90% 90 – 100% Brazil new Forest Code Illegallargefarmshavetorecover 80% ofarea
Potential for CO2 sink in Amazonia Clear-cutareas 200,000 km2 (30% of area) 10 Gt CO2eq (2015-2020) Floresta (biomassafter 5 years)
Impact of reforestation in Amazonia Net sink in Amazonia (2015-2020) World’semissiongrowth in fossilfuels (2% a.a) (2015-2020) 10 Gt CO2eq 12 Gt CO2eq From 2015 to 2020, reforestation in Amazonia could stabilize global emissions
Can Brazil hold back REDD+? Possible sink in Amazonia 10 Gt CO2eq From 2015 to 2020, the potential carbon sink in Brazil would be double the entire worldwide market for REDD REDD 5 Gt CO2eq
Impact of reforestation in Amazonia Net sink in Amazonia (2015-2020) World’semissiongrowth in fossilfuels (2% a.a) 10 Gt CO2eq 12 Gt CO2eq Why pay for avoided deforestation when you can stabilize the world’s emissions?
Can we build REDD+ without institutions? We cannot have REDD+ without institutions If we have institutions, do we need REDD+? Justice Public health Knowledge Information
Will REDD create self-defeating outcomes? ‘We have a resource we would like to get money for. Either you pay us for biodiversity services or we will sell the forest to Malaysian logging companies.’ (Guyana government officer)
Thanks to INPE’s Land Change team • Dalton Valeriano • Cláudio Almeida • LuizMaurano • Isabel Escada • SilvanaAmaral …and also to • Bertha Becker (UFRJ) • Tiago Carneiro (UFOP) • Roberto Araújo • Ana Aguiar • Pedro Andrade-Neto • Miguel Monteiro