Download
1 / 32
320 likes | 460 Vues
S7 --Roads, Land-Cover and Land-Use Change in Brazilian Amazon. Chairs: Eustáquio Reis and Marcellus Caldas IPEA and MSU III LBA Scientific Conference Brasília, July 27-29, 2004. Motivation and Content.

E N D
S7 --Roads, Land-Cover and Land-Use Change in Brazilian Amazon Chairs: Eustáquio Reis and Marcellus Caldas IPEA and MSU III LBA Scientific Conference Brasília, July 27-29, 2004
Motivation and Content The section opens a pre-concluded debate. Roads are often regarded as the primary factor in tropical deforestation. This view should be taken cautiously, however. At basin wide level, econometric studies based upon historical municipal data suggest that the direction of causation between roads and deforestation is open to controversy. Furthermore, at local level, the manner in which roads alter the environments is not easily described. Fieldwork suggests that certain kinds of road may be built in the wake of deforestation, to respond to colonist demands for transportation services. In any event, the time has come to take stock of our knowledge of the relationship between transportation networks, land-cover and land-use changes, which will be the theme of this special session. At both micro and macro level, dicussions will take historical and geographical perspective
Determinants and Trends of Brazilian Amazon SetlementAjax B. Moreira Eustáquio J. ReisIPEA/Brazil Presentation at the III LBA Scientific Conference Brasília, July 26-29, 2003
Outline • Introduction • IPEA/DESMAT database • Concepts and measures • Model Specification Data www.ipeadata.gov.br Ref. www.nemesis.org.br
Prototypical spatio-temporal pattern of deforestation • Squatter doing shifting cultivation and loggers are leading agents of (small scale) deforestation in wild areas • Cattle ranchers and large scale deforestation come in the second stage of frontier settlement • Commercial crops penetrate in the third stage replacing pasture area with relatively small impact on deforestation in consolidated areas
IPEA/DESMAT database • Panel data at municipal level based upon IBGE Census data, 1970-2000 • Agricultural Census (5yr, 1970-1995): value and quantity of outputs and inputs, land use, employment by property type (proprietor, renter, sharecroper, squater) and farm size (14 classes) • Demographic Census (10yr, 190-2000): rural and urban population, migration, income, life expectancy, mortality • Annual surveys (1975-2000) on agriculture, cattle ranching and logging • IBGE – Diagnóstico da Amazônia Legal: soil, vegetation, precipitation, temperature, forest inventory (biomass) • DNER: Roads, 1968, 1975, 1985, 1991, 1995
Concepts and measures • Minimum comparable area (MCA) • Measures of deforestation at municipal and at Census tract level • Transport costs most cost effective routes to each market • Control variables: structural characteristics of municipalities
Minima comparable areas • Municipio (county) is the smallest Brazilian political-administrative unit • AML had 312 municipalities in 1970 and 763 in 1997 • Changes in number and area of municipalities aggeragation in minima comparable areas (MCA) for consistent intertemporal comparisons • 256 MCA in the 1970-97 300 MCA in 1985-96 • Contiguity matrices and distances to federal and state capital
AML: Minimum comparable areas for the period 1970-1997 and municipal areas in 1997 (fainted lines) Source: IBGE/DGC/DCAR for municipal areas in 1997 Elaboration: IPEA/DIMAC
Census tract • Smallest geographic unit for compilation of census data (census tract subdistrict district municipality) • In the 1996 Agricultural Census, AML had 9315 Census tracts, out of which 8348 were located in rural areas. • Average figures for a Census tract: number of farms, 88, farm area, 12956 ha, pasture area, 5558 ha, and herd size, 4031 heads. • The detailed geographic picture of agricultural settlement in 1996 crucial for spatial models
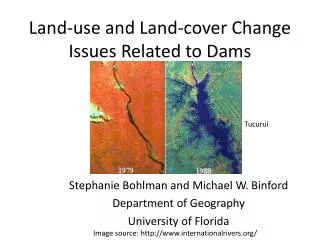
Deforestation measures at municipal level • Satelite images: • Sources: • IBGE/DAML: 1971-76, 1977-1987, 1988-91 • INPE: changes in 1991-92, 1992-94, 1995-1999 • Ibama 1996-99 • NASA/UNH 1975, 1978, 1988, 1992, 1996 • Forest phisionomy • Savanna areas excluded • Scale problem • Consistency among different periods/sources
Deforestation measures at municipal level • Agricultural Census land use categories deforestation proxy: • Deforestated area = Crop area + Pastures + Fallow areas + Planted forests • Agricultural Census 1970, 75, 80, 85, 1995/96: • Planted pasture: ambiguous category • Abandoned farms excluded • Consistency 1985/95: survey off-season • Size and type of establishment 1985/1996
Empirical Questions • Spatio-temporal pattern of deforestation process using using logging volume, herd, and crop area as proxies. • Identification of the economic determinants of deforestation transportation costs • How the spatio-temporal process is affected by structural characterististics of municipalities
Model Specification • Setllement in municipality m and time t is described by the vector y(m,t) which is assumed to depend of lagged local conditions, y(m,t-1), lagged conditions in the neighborhood areas, W.y(t-1), and of exogenous variables, z(m,t) • y(m,t) = + .y(m,t-1) + .W.y(m,t-1)+ z(m,t)+e(m,t) where m and t refer to municipalities and time, W to a contiguity matrix, z to exogenous variables (like soil, vegetation, rainfall, transport cost), and e is the residual
Model Specification • Effects propagate in time and space but contemporaneous spatial effects are assumed to be negligible • The model can be used to test precedence in the temporal and spatial interactions between variables (logging, agriculture, and cattle ranching, etc.) • It can also be used to identify the effects of the structural characteristis c(m) on the interaction between these variables with both annual and Census data:
Model Specification • Irrestricted specification: y(m,t) = c I(c(m)){(c)+ (c) y(m,t-1) +(c) W y(m,t-1)+ (c)z(m,t)}+e(m,t) • Restricted specification: y(m,t) = + .y(m,t-1) +.W.y(m,t-1)+ .z(m,t)+e(m,t) Where y = (log, cattle, crop) and c(m) class of structural characteristic to which the municipality belongs • Specification of exogenous z(m,t) affects only the steady state level of y(m,t) but c(m,t) affects also and , i.e, the process of propagation in time and space
Structural Characteristics • Vegetation • Dense forest dominance (>75% of area) • Savanna dominance (> 75% of area) • Open forest dominance (>75% area) • Soil topology • Plain (% area) • Mountainous (% of area) • Intermediate topology (% of area) • Rainfall precipitation • Humid areas (difined by the amount of precipitation in the seat of municipality) • Other
Structural Characteristics • Transport cost • Categories of values of the transport cost gradient to: • National markets (São Paulo) • Local markets (State capitals)
Variables • Geographic density of the product (relationship between the product and the area of the municipality) • percentage of the area of the municipality employed for the activity. • The access conditions and transport costs are specified as exogenous variables (predetermined).
Major Results • Temporal and spatial interactions are significant • Logging is an autonomous process: timber extraction neither precedes not is preceded by any other production indicator • rainfall is the geo-ecological conditioning factor in the occupation process;vegetation cover and relief are not important determinants
Major Results • cattle herd is unstable and thus vulnerable to exogenous stimuli • all three activities the proportion of land use is a stationary process • reduction in transport costs for all three activities induce land use intensification and higher productivity