Download
1 / 16
160 likes | 245 Vues
Bishkek, 7th of December 2009. Training Workshop: Baseline Study of the Kyrgyz Power Sector for Clean Development Mechanism. Presentation III: Case Study for Carbon Finance of Hydropower. Johannes Laubach. Content. 1. CDM Power Sector Baseline Azerbaijan. 2.

E N D
Bishkek, 7th of December 2009 Training Workshop: Baseline Study of the Kyrgyz Power Sector for Clean Development Mechanism Presentation III: Case Study for Carbon Finance of Hydropower Johannes Laubach
Content 1 CDM Power Sector Baseline Azerbaijan 2 Mil Hydropower Station CDM Project Gilanchay Cascade Hydropower CDM Project 3
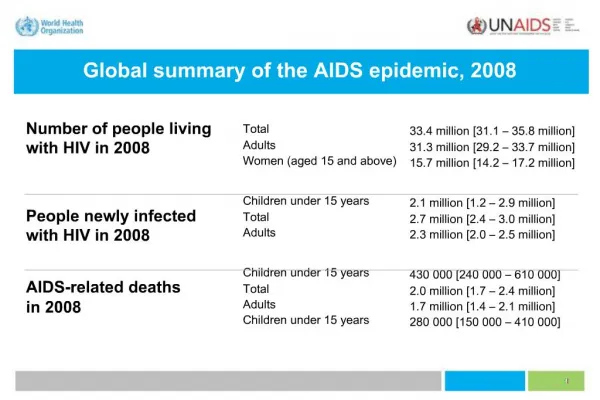
Power Sector Azerbaijan (2006) Name of station Commissioning Fuel Design capacity Actual capacity Year [MW] [MW] 1. Azerbaijan TPS 1981 - 1990 Gas/oil 2,400 1,900 1) 2. Ali-Bayramly TPS 1962 - 1968 Gas/oil 1,050 840 3. Severnaya TPS 1960 Gas/oil 150 80 4. Severnaya TPS (CC) 2003 Gas 400 350 5. Sumgait CHP No. 1 1959 - 1962 Gas/oil 200 - 6. Sumgait CHP No. 2 1966 - 1972 Gas/oil 220 - 7. Sumgait CHP No. 3 (CC) 2004 Gas/oil 32 32 8. Baku No. 1 (GT) 2000 Gas/oil 106 106 9. Baku CHP No. 2 (CHP) 1954 Gas/oil 24 - 10. Gandja 1962 Gas/oil 75 25 11. Nakhichevan GT 1994 Gas 64 - Total on thermal power stations - 4,721 3,333 (81%) 12. Shamkir HPS 1982 - 1983 Hydro 380 340 13. Yenikend HPS 2000 - 2003 Hydro 150 120 14. Mingechavir HPS 1953 - 1954 Hydro 401.6 300 15. Yarvara HPS 1957 Hydro 16.5 11 16. Araz HPS 1971 Hydro 22 20 17. Tarta HPS 1975 Hydro 50 - 18. Small sized HPS various Hydro 19.4 - Total on hydropower stations (HPS) Hydro 1,040 791 (19%) Total on energy system - - 5,761 4,124
Ex-ante Simple Operating Margin Simple OM: Weighted-average emission rate excluding low-operating cost and must-run power plants: • 2002: 0.76 t CO2/MWhe • 2003: 0.73 t CO2/MWhe • 2004: 0.70 t CO2/MWhe • 2005: 0.70 t CO2/MWhe • Average 2003 - 2005: 0.72 t CO2/MWhe => Azerenerji gradually improves efficiency of thermal power generation => OM will rapidly decrease in close future => “ex-ante” OM clearly preferable to “ex-post” OM
Ex-ante Build Margin 5 most recently commissioned power plants: Commissioned 2003 2004 2005 Average Weight [t CO2/MWhe] [%] AZERKHIMIYA CC CHP 2003 - 0.46 0.46 0.46 1 *) YENIKEND 1 - 4 2000/03 0 0 0 0 3 SHIMAL (SEVERNAYA) CC 1 2003 0.43 0.43 0.46 0.44 16 BAKU-1 GT-1, GT-2 2000 0.75 0.70 0.77 0.74 5 AZERBAIJAN DRES 1 - 8 1981-90 0.82 0.81 0.81 0.81 76 Weighted average 0.75 0.72 0.72 0.73 => Next power station to be commissioned (Sumgait CCPP, 517 MW, 2007?!) will kick Azerbaijan DRES out of the Build Margin => Build Margin will decrease to 0.4 - 0.5 t CO2/MWhevery soon!!!
Ex-ante Combined Margin 2003 2004 2005 Average Weight t CO2/MWhe % Operating Margin 0.73 0.70 0.70 0.72 50 Build Margin 0.75 0.72 0.72 0.73 50 Combined Margin 0.74 0.71 0.12 0.72 50 => 0.72 t CO2/MWhe was applicable for validation in 2006!
Technical Data Dam & reservoir Dam height: 26 m Water reservoir: 55,000 m³ => “run-of-river” Reservoir surface (estimated): 5,000 - 10,000 m² ??? Hydropower station Design flow: 100.5 m³/s Design water head 35 m Design capacity: 3 x 9.4 = 28.2 MW Average annual generation: 143 mln kWh/yr Construction time: 3 years
Emission Reductions Baseline emissions 1st crediting period 143,000 MWh/yr x 0.72 t CO2/MWhe = 103,000 t CO2/yr Project emissions Power density: 28.2 MW : 10,000 m² = 2,800 W/m² > 10 W/m² => 143,000 MWh/yr x 0 t CO2/MWhe = 0 t CO2/yr Emission reduction 1st crediting period (ex-ante) 103,000 t CO2/yr - 0 t CO2/yr = 103,000 t CO2/yr = 103,000 CERs/yr Emission reduction 2nd/3rd crediting periods (estimated) 143,000 MWh/yr x ~0.4 t CO2/MWhe = ~57,000 CERs/yr
Technical Data Cascade of 18 “small” Hydropower plants Design capacity: 43.4 - 52.2 MW Average annual generation: 194 - 231 mln kWh/yr Construction time: 6 years, but 1.5 years per plant (commissioning ~ 2010 - 2015)
Emission Reductions Baseline emissions 1st crediting period ~200,000 MWh/yr : 0.89 x 0.72 t CO2/MWhe = ~161,000 t CO2/yr No project emissions Emission reduction 1st crediting period (ex-ante) ~161,000 t CO2/yr= ~161,000 CERs/yr Emission reduction 2nd/3rd crediting periods (estimated) ~200,000 MWh/yr : 0.89 x ~0.4 t CO2/MWhe = ~90,000 CERs/yr
Thank You! Average OM method yields low baseline emissions and consequently low credits !