Download

1 / 15

E N D
Quality Assurance Challenges Associated with Decentralizing the Entry of Tuberculosis Surveillance Data TB PEN ConferenceSeptember 2011Sandra P. Matus, M.P.H., Epidemiologist, PEN Focal PointAndrea Palmer, Karen Fujii, Cathy Goldsborough, Maureen Donovan, ToriMiazad, Wendy CroninMaryland Department of Health and Mental HygieneInfectious Disease and Environmental Health AdministrationCenter for Tuberculosis Control and Prevention
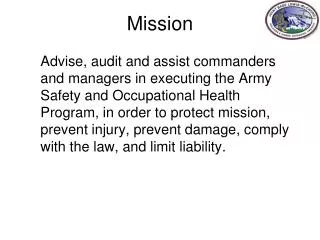
MISSION • To improve the health of Marylanders by reducing the transmission of infectious diseases, helping impacted persons live longer, healthier lives, and protecting individuals and communities from environmental health hazards • We work in partnership with local health departments, providers, community based organizations, and public and private sector agencies to provide public health leadership in the prevention, control, monitoring, and treatment of infectious diseases and environmental health hazards.
Background • Pre-2009 • TIMS database • Used MD-specific form • Data entered at state level • Random surveys revealed data were 99-100% accurate • Post-2009 • NEDSS database • Use revised RVCT • TB data entry was decentralized to local health departments (LHDs)
Purpose • Assess the accuracy and completeness of TB patient data entered into the new surveillance system by LHDs, including Baltimore City • Identify training needs and develop materials to assist in the accurate completion of the RVCT
Methods Maryland Case Numbers, 2009 • For LHDs with <10 cases in 2009, all patient records for 2009 were reviewed; for LHDs with ≥10 cases in 2009, a sampling of records, proportionately distributed across case managers, were reviewed. • RVCT forms were compared with patient records for completeness and accuracy, with variables scored. No TB 1 - 3 cases 4 - 8 cases 17 - 70 cases
Study Demographics Country of Origin U.S.-Born Foreign-Born
Results Summary • Over a period of 8 months, 100 patient record reviews required an average of 40 minutes per record (~67 total hours for data collection). • Of 8060 applicable RVCT responses: • 491 (6%) were incorrect (LHD median: 4%, range:0-8%) • 625 (8%) were missing (LHD median: 3%, range:0-33%) • 305 (4%) were not documented (LHD median: 1%, range=0-8%) • The greatest proportions of RVCT errors were as follows: • 41% (39/96) incorrect: “Date Reported” • 42% (25/60) missing: “Evidence of Miliary TB” subcategory under “Initial Chest Radiograph” • 28% (28/99) not documented: “Immigration Status at First Entry” • “Therapy Start Date” was considered acceptable: • Median days difference between RVCT and chart documentation: 1 (range: 1-4)
Results **RVCT responses were marked as: I=Incorrect: Response differed from data in the patient record M=Missing: No response on RVCT ND=Not Documented: Response could not be substantiated by data in the patient record NA=Not Applicable: Field did not apply to the patient
Results, cont’d. **RVCT responses were marked as: I=Incorrect: Response differed from data in the patient record M=Missing: No response on RVCT ND=Not Documented: Response could not be substantiated by data in the patient record NA=Not Applicable: Field did not apply to the patient
Results, cont’d. Range (in days) Tissue/Fluids Culture: Date Reported (1-119) (1-74) (1-30) (1-24) (1-190) (1-20 )
Examples of Errors • Excess alcohol – RVCT marked “no”. Patient record later documented that patient was repeatedly coming to clinic under the influence. • Homelessness – Adult patient alternating stays between family and friends (transient housing) was marked as “not homeless.” • Primary Occupation – Two-year-old marked as “unemployed.” Child should have been marked as “not seeking employment.”
Conclusions • Decentralizing data entry from state to local level resulted in a significant decline in accuracy despite education and training efforts. • Data quality assessments of this magnitude are time-consuming and costly. • Ongoing QA of reported data essential to ensure accurate information for local, state, and national use.
Recommendations • Focus on problem variables through • Development of RVCT quick reference guides • Revised RVCT trainings • Standardize quality assurance measures and assess periodically, both centrally and locally. • Duplicate study in other states and programs to identify possible trends and problem fields.
Acknowledgements DHMH TB: Andrea Palmer Karen Fujii Cathy Goldsborough Maureen Donovan ToriMiazad Wendy Cronin Program Evaluation Team: Yvonne Richards Bonnie Lewis Judy Thomas Nicketta Johnson Loretta Gossett And all other local TB program staff who helped with this project!